Biodiversity and Classification

Section A: Multiple Choice Questions
Choose the correct answer from the options A-D provided.
- Question 1 [1]
Which term describes the total variety of all living organisms, their genetic differences, and the ecosystems they form?- Ecosystem diversity
- Biodiversity
- Species richness
- Genetic variation
- Question 2 [1]
A wetland ecosystem contains 45 different plant species, 23 bird species, 12 mammal species, and 8 reptile species. What is the total species richness of this ecosystem?- 45
- 88
- 23
- 65
- Question 3 [1]
The binomial nomenclature system was developed by which scientist?- Charles Darwin
- Carolus Linnaeus
- Gregor Mendel
- Robert Hooke
- Question 4 [1]
In the scientific name Panthera leo, which part represents the species name?- Panthera
- leo
- Both Panthera and leo
- Neither, it is the genus
- Question 5 [1]
Thandi surveyed two forest patches of equal size. Forest A contained 30 species with 300 individuals, where one species made up 200 individuals. Forest B contained 30 species with 300 individuals, where each species had 10 individuals. Which statement is correct?- Forest A has higher species evenness than Forest B
- Forest B has higher species evenness than Forest A
- Both forests have identical biodiversity
- Forest A has higher species richness than Forest B
- Question 6 [1]
Which of the following is not a major threat to biodiversity?- Habitat destruction
- Invasive species
- Pollination by native insects
- Climate change
- Question 7 [1]
The hierarchical classification system arranges organisms from the broadest to the most specific grouping. Which sequence is correct?- Kingdom → Phylum → Class → Order → Family → Genus → Species
- Species → Genus → Family → Order → Class → Phylum → Kingdom
- Kingdom → Class → Phylum → Order → Family → Genus → Species
- Phylum → Kingdom → Class → Order → Family → Genus → Species
- Question 8 [1]
A national park recorded 120 species of plants in Year 1. After a severe drought in Year 2, only 85 species remained. What is the percentage decrease in species richness?- 29.2%
- 35.0%
- 41.2%
- 70.8%
- Question 9 [1]
Which level of biodiversity refers to the variety of alleles and genes within a population of a single species?- Ecosystem diversity
- Species diversity
- Genetic diversity
- Habitat diversity
- Question 10 [1]
Bongani collected insects from two gardens. Garden X had 50 individuals belonging to 5 species (10 of each species). Garden Y had 50 individuals belonging to 5 species, but 40 individuals were from one species and the other 4 species had 2-3 individuals each. If both gardens are compared using a biodiversity index that considers both richness and evenness, which statement is most accurate?- Garden X will have a lower biodiversity index than Garden Y
- Garden X will have a higher biodiversity index than Garden Y
- Both gardens will have identical biodiversity indices
- Biodiversity index cannot be calculated without knowing the exact species names
Section B: Structured Questions
Question 1: Levels of Biodiversity and Threats
Scenario: The Kruger National Park is one of South Africa's largest game reserves and exhibits high biodiversity. Scientists have identified three main levels of biodiversity present in the park: genetic diversity within elephant populations, the variety of species including the Big Five and hundreds of bird species, and the range of ecosystems from riverine forests to open savanna grasslands.
- Define the term biodiversity. [2]
- Explain why genetic diversity within the elephant population is important for the long-term survival of the species. [3]
- Invasive plant species such as Chromolaena odorata have spread into parts of the Kruger National Park, outcompeting native vegetation. Discuss two ways in which invasive species reduce biodiversity in an ecosystem. [4]
- A conservation team surveyed a 10 km² section of the park and recorded 340 plant species. After a controlled burn management practice, they recorded 385 plant species in the same area. Calculate the percentage increase in species richness and suggest one reason why species richness might have increased after the burn. [4]
Question 2: Classification and Binomial Nomenclature
Scenario: Lerato is a young scientist studying South African flora. She discovered a new plant species in the Cederberg Mountains. To classify this plant, she needs to follow the principles of binomial nomenclature and place it within the correct taxonomic hierarchy.
- State two rules that must be followed when writing a scientific name using binomial nomenclature. [2]
- Lerato's new plant species belongs to the genus Protea. She names the species Protea cedarbergensis. Identify the genus name and the species name in this binomial name. [2]
- The full classification of this plant from broadest to most specific grouping is as follows: Kingdom Plantae, Phylum Anthophyta, Class Magnoliopsida, Order Proteales, Family Proteaceae, Genus Protea, Species cedarbergensis. Explain why classification systems that group organisms hierarchically are useful to scientists worldwide. [3]
- Lerato compares her newly discovered species with an existing species, Protea cynaroides (the King Protea). Both belong to the same genus but different species. What does this tell you about the degree of similarity between the two plants compared to two plants from different families? Justify your answer. [4]
Section C: Data Analysis and Graphing
Question 1: Species Diversity in Different Habitats
Scenario: Sipho conducted a biodiversity survey in three different habitats around his school: a natural grassland area, a vegetable garden, and a paved sports field with sparse weeds. He recorded the number of plant species and the total number of individual plants in a 100 m² sample area in each habitat. His results are shown in the table below.
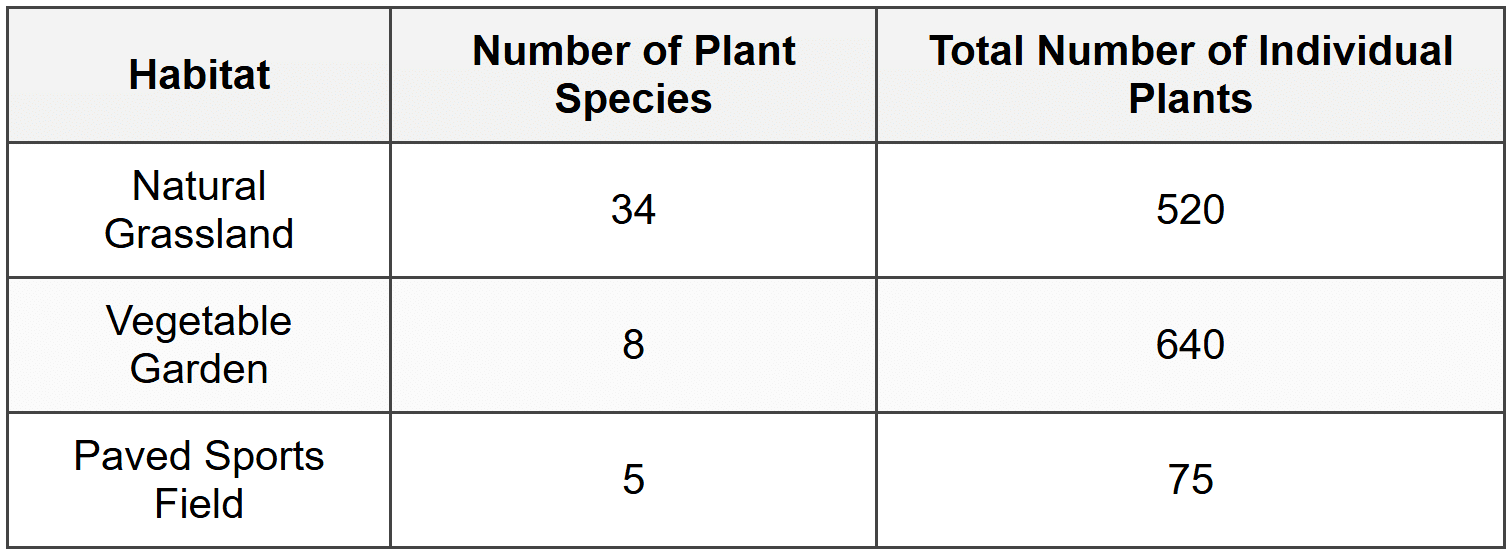
- Identify the habitat with the highest species richness and state the number of species recorded. [2]
- Calculate the average number of individuals per species in the Natural Grassland. Show all working and express your answer to two decimal places. [3]
- Sipho knows that high species richness does not always mean high biodiversity, because species evenness also matters. The vegetable garden has 8 species, but 6 of those species are represented by only 10 individuals each, while the remaining 2 species account for 580 individuals. Explain why the vegetable garden is likely to have lower biodiversity than the natural grassland, even though it has a relatively high total number of individual plants. [4]
- Suggest two practical actions the school could take to increase the biodiversity of the paved sports field area. [2]
Section D: Scientific Investigation
Question 1: Investigating the Effect of Habitat Fragmentation on Species Richness
Scenario: Amahle and her research team investigated how habitat fragmentation affects bird species richness. They selected five forest patches of different sizes within a region that was once a continuous forest but has been divided by agriculture and urban development. They recorded the area of each forest patch in hectares (independent variable) and the number of bird species observed in each patch over a three-month period (dependent variable). All surveys were conducted during the same season, using the same observation methods, and at the same time of day.
Results:
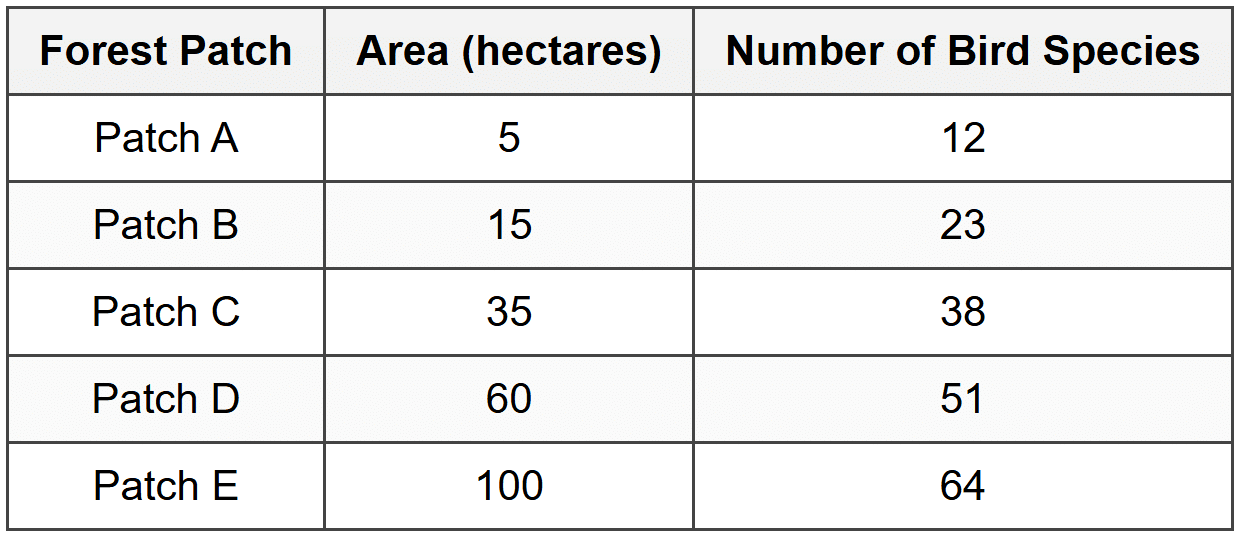
- Identify the independent variable in this investigation. [1]
- Identify the dependent variable in this investigation. [1]
- Name one controlled variable in this investigation and explain why it must be kept constant. [2]
- Write a suitable hypothesis for this investigation using the format: If [condition], then [expected result], because [scientific reason]. [3]
- Based on the results in the table, state whether the data supports the hypothesis you wrote in part (d). Provide a scientifically justified conclusion that refers to the trend shown in the data. [4]
- Amahle's team wants to improve the reliability of their investigation. Suggest one way they could modify their method to increase the reliability of the results. [2]
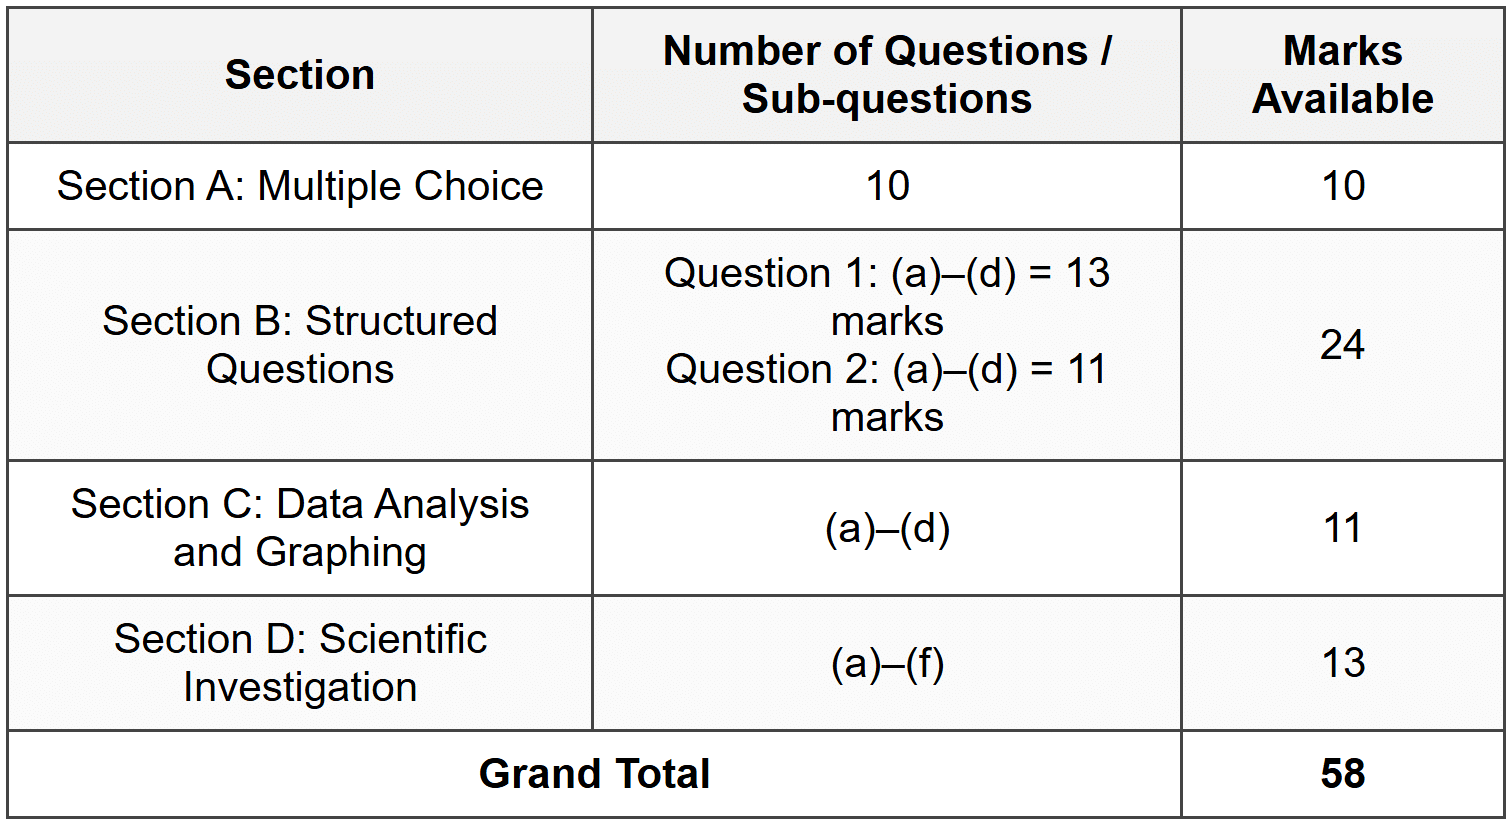
Grand Total: [75]
Answer Key
Well done for completing the worksheet! Before you check your answers, make sure you have attempted every question and shown all your working for calculations. Use this answer key to mark your own work carefully, and take note of where you can improve. Remember, making mistakes is part of learning-use them to strengthen your understanding of biodiversity and classification!
Section A: Multiple Choice Questions
Section A - Question 1
Answer: B - Biodiversity
Biodiversity is the term that encompasses the total variety of life, including all organisms, their genetic variation, and the ecosystems they inhabit. This is not simple recall because you must understand that biodiversity includes all three levels: genetic, species, and ecosystem diversity.
Section A - Question 2
Answer: B - 88
Species richness is the total number of different species present. You must add all the species together: 45 + 23 + 12 + 8 = 88 species. This requires calculation and understanding of the term species richness.
Section A - Question 3
Answer: B - Carolus Linnaeus
Carolus Linnaeus developed the binomial nomenclature system in the 18th century, which is still used today to name species scientifically.
Section A - Question 4
Answer: B - leo
In binomial nomenclature, the first word is the genus name (Panthera) and the second word is the species name (leo). Understanding the structure of scientific names is essential for classification.
Section A - Question 5
Answer: B - Forest B has higher species evenness than Forest A
Species evenness refers to how evenly individuals are distributed among species. Forest A is dominated by one species (200 out of 300 individuals), so it has low evenness. Forest B has equal representation of all species, giving it high evenness. This question requires you to compare and analyse evenness, not just richness.
Section A - Question 6
Answer: C - Pollination by native insects
Pollination by native insects is a natural ecological process that supports biodiversity, not a threat. The other options (habitat destruction, invasive species, climate change) are all major threats to biodiversity.
Section A - Question 7
Answer: A - Kingdom → Phylum → Class → Order → Family → Genus → Species
This is the correct hierarchical sequence from broadest to most specific. Remembering the order is essential for classification.
Section A - Question 8
Answer: A - 29.2%
Calculation:
Decrease in species = 120 - 85 = 35 species
Percentage decrease = (35 ÷ 120) × 100
= 0.2917 × 100
= 29.17%
Rounded to one decimal place = 29.2%
This question requires you to calculate percentage change, which is an application-level skill.
Section A - Question 9
Answer: C - Genetic diversity
Genetic diversity refers to the variety of alleles and genes within individuals of the same species. This is important for adaptation and resilience of populations.
Section A - Question 10
Answer: B - Garden X will have a higher biodiversity index than Garden Y
Garden X has high species evenness (equal representation of each species), which increases biodiversity index values. Garden Y is dominated by one species, resulting in low evenness and a lower biodiversity index. This question requires you to evaluate and compare two scenarios using both richness and evenness concepts.
Section B: Structured Questions
Section B - Question 1(a)
Biodiversity is the variety of all living organisms in a particular area, including the diversity of species, the genetic variation within species, and the variety of ecosystems they form. It represents the total richness of life on Earth or within a specific region.
Section B - Question 1(b)
Genetic diversity is important for the long-term survival of the elephant population because it provides a wide range of alleles that enable the population to adapt to changing environmental conditions, such as disease outbreaks, climate change, or habitat loss. Populations with low genetic diversity are more vulnerable to extinction because they lack the genetic variation needed for adaptation and resilience. Genetic diversity also reduces the risk of inbreeding, which can lead to genetic disorders and reduced fitness.
Section B - Question 1(c)
Invasive species reduce biodiversity in the following ways:
- Competition for resources: Invasive species often outcompete native species for resources such as light, water, nutrients, and space. This can lead to a decline or local extinction of native species, reducing species richness.
- Disruption of food webs: Invasive species may not have natural predators in the new ecosystem, allowing their populations to grow unchecked. They may also prey on native species or disrupt pollination and seed dispersal relationships, leading to ecosystem imbalance and loss of species diversity.
Section B - Question 1(d)
Step 1: State the formula
Percentage increase = [(new value - original value) ÷ original value] × 100
Step 2: Substitute the values
Percentage increase = [(385 - 340) ÷ 340] × 100
Step 3: Show all working
= [45 ÷ 340] × 100
= 0.1324 × 100
= 13.24%
Step 4: Final answer
The percentage increase in species richness is 13.24% (or 13.2% rounded to one decimal place).
Reason for increase: Controlled burns remove dominant plant species and thick vegetation layers, allowing light to reach the soil. This stimulates the germination of seeds that were previously dormant, increasing the number of species that can grow in the area. Fire can also release nutrients back into the soil, supporting new plant growth.
Mark allocation note: 2 marks for correct calculation with working; 2 marks for a scientifically sound reason.
Section B - Question 2(a)
Two rules of binomial nomenclature are:
- The scientific name consists of two parts: the genus name (written first with a capital letter) and the species name (written second in lowercase).
- The entire scientific name must be written in italics (or underlined if handwritten).
Section B - Question 2(b)
Genus name: Protea
Species name: cedarbergensis
The genus name is always written first and begins with a capital letter; the species name is written second and is always lowercase.
Section B - Question 2(c)
Hierarchical classification systems are useful because they organize the vast diversity of life into structured, nested groups based on shared characteristics and evolutionary relationships. This makes it easier for scientists worldwide to communicate clearly about organisms, identify unknown species, study evolutionary patterns, and predict characteristics of newly discovered organisms based on their classification. A universal system avoids confusion caused by common names, which vary by language and region.
Section B - Question 2(d)
Because Protea cedarbergensis and Protea cynaroides belong to the same genus, they are closely related and share many structural and genetic characteristics. Organisms in the same genus are more similar to each other than organisms from different families. Two plants from different families would belong to different orders or even different classes, meaning they diverged much earlier in evolutionary history and share fewer characteristics. The closer two organisms are in the classification hierarchy, the more recently they shared a common ancestor and the more traits they have in common.
Section C: Data Analysis and Graphing
Section C - Question 1(a)
The habitat with the highest species richness is the Natural Grassland, with 34 species recorded.
Section C - Question 1(b)
Step 1: State the formula
Average number of individuals per species = Total number of individuals ÷ Number of species
Step 2: Substitute the values
Average = 520 ÷ 34
Step 3: Show all working
= 15.294117...
Step 4: Final answer
The average number of individuals per species in the Natural Grassland is 15.29 individuals per species (to two decimal places).
Mark allocation note: 1 mark for correct formula; 1 mark for correct substitution and working; 1 mark for correct final answer to two decimal places.
Section C - Question 1(c)
The vegetable garden is likely to have lower biodiversity than the natural grassland because it has low species evenness. Even though the vegetable garden has a high total number of individual plants (640), most of these individuals belong to only two species (580 out of 640). The remaining six species are poorly represented, with only 10 individuals each. In contrast, the natural grassland has 34 species, suggesting that individuals are more evenly distributed among many species, which increases overall biodiversity. Biodiversity depends on both species richness and evenness-the vegetable garden's low evenness reduces its biodiversity despite having many individual plants.
Mark allocation guide: Full marks (4) require mention of species evenness, explanation that the vegetable garden is dominated by two species, and reference to the natural grassland having better distribution. Partial marks (2-3) for recognizing low evenness or unequal distribution without full explanation.
Section C - Question 1(d)
Two practical actions to increase biodiversity on the paved sports field:
- Remove some of the paving and plant a variety of native plant species to create habitat and food sources for insects, birds, and other organisms.
- Introduce containers or garden beds with indigenous plants around the edges of the sports field, or create a small wildlife-friendly garden area to provide shelter and attract pollinators.
Section D: Scientific Investigation
Section D - Question 1(a)
The independent variable is the area of the forest patch (in hectares).
This is the variable that Amahle and her team deliberately selected and varied across the investigation to observe its effect on bird species richness.
Section D - Question 1(b)
The dependent variable is the number of bird species observed in each patch.
This is the variable that is measured in response to changes in the independent variable (forest patch area).
Section D - Question 1(c)
One controlled variable is the season during which surveys were conducted.
This must be kept constant because bird species richness can vary significantly between seasons due to migration patterns, breeding behavior, and food availability. If surveys were conducted in different seasons, differences in species richness might be due to seasonal changes rather than forest patch area, making the results unreliable.
Other acceptable controlled variables: time of day of surveys (bird activity varies); observation methods used; observer experience; weather conditions during surveys.
Section D - Question 1(d)
Hypothesis:
If the area of a forest patch increases, then the number of bird species observed will increase, because larger habitat areas provide more resources, greater variety of microhabitats, and can support larger and more diverse populations of birds.
Mark allocation note: 1 mark for correct "if" statement identifying the independent variable; 1 mark for correct "then" statement identifying the expected change in the dependent variable; 1 mark for a scientifically valid "because" statement explaining the reasoning.
Section D - Question 1(e)
The data supports the hypothesis. The results show a clear positive relationship between forest patch area and the number of bird species: as the area of the forest patch increases from 5 hectares to 100 hectares, the number of bird species increases from 12 species to 64 species. Every larger forest patch recorded a higher number of bird species than smaller patches, with no exceptions. This supports the hypothesis that larger habitat areas provide more resources, nesting sites, and ecological niches, enabling them to support greater bird species richness. Habitat fragmentation reduces the area available and isolates populations, which decreases biodiversity.
Mark allocation guide: Full marks (4) require: clear statement that hypothesis is supported; reference to the trend in the data (increasing area leads to increasing species richness); scientific explanation linking habitat area to resources and biodiversity. Partial marks (2-3) for stating hypothesis is supported with some reference to data, but lacking full scientific reasoning.
Section D - Question 1(f)
One way to increase reliability is to repeat the survey in each forest patch multiple times (at different times within the same season or over multiple years) and calculate an average number of bird species for each patch. This reduces the effect of random variation, such as temporary absences of certain species due to weather, food availability, or disturbance, and makes the results more reliable and reproducible.
Other acceptable answers: increase the number of forest patches studied; use multiple observers and compare results; conduct surveys over a longer time period.
Mark Allocation Summary
Note to learner: Compare your answers carefully with the model answers provided. Pay special attention to calculation questions-make sure you showed all steps and included units where required. For explanation questions, check that you used scientific terminology correctly and gave enough detail. If you lost marks, revise those concepts and try similar questions again. Keep up the excellent effort!


