Biosphere to Ecosystems

SECTION A: MULTIPLE CHOICE
(Total: 10 marks)
1. Which of the following correctly describes the biosphere?
A. Only the atmosphere and hydrosphere combined
B. The part of Earth where life exists, including land, water, and air
C. Only the lithosphere where organisms live
D. The region of Earth that contains only plant life
2. An ecosystem is best defined as:
A. All the organisms of the same species living in an area
B. The physical environment in which organisms live
C. A community of organisms interacting with each other and their physical environment
D. Only the biotic components in a specific area
3. Which of the following is an abiotic component of an ecosystem?
A. Grass
B. Bacteria
C. Temperature
D. Fungi
4. A population refers to:
A. All the different species in a particular area
B. All the organisms of one species living in a particular area at a particular time
C. The total number of organisms in the biosphere
D. Only the plants in a given habitat
5. If a grassland ecosystem has 500 impala, 200 zebra, and 50 wildebeest, how many populations are represented?
A. 1
B. 2
C. 3
D. 750
6. The SI unit for measuring the area of an ecosystem is:
A. m
B. m²
C. m³
D. m·s⁻¹
7. In a pond ecosystem, the community includes:
A. Only the fish
B. The water, sunlight, and temperature
C. All the living organisms including fish, frogs, algae, and bacteria
D. Only the producers
8. A researcher measures a small forest ecosystem as 2000 m long and 1500 m wide. What is the total area of this ecosystem?
A. 3000 m²
B. 3500 m²
C. 3 000 000 m²
D. 7000 m²
9. Which statement best explains the relationship between the biosphere and ecosystems?
A. The biosphere is smaller than an ecosystem
B. Ecosystems are the fundamental units that make up the biosphere
C. The biosphere and ecosystems are the same thing
D. Ecosystems exist outside the biosphere
10. In a marine ecosystem, if the population density of seaweed is calculated as 120 individual plants per 40 m² of ocean floor, what is the density in plants per m²?
A. 160 plants·m⁻²
B. 80 plants·m⁻²
C. 3 plants·m⁻²
D. 4800 plants·m⁻²
SECTION B: STRUCTURED QUESTIONS
(Total: 30 marks)
Question 11
11. Thabo is studying a small wetland ecosystem near his school in KwaZulu-Natal.
(a) Define the term habitat.
(b) Distinguish between biotic and abiotic factors in an ecosystem by giving two examples of each that Thabo might observe in the wetland.
(c) Explain why both biotic and abiotic factors are necessary for the functioning of an ecosystem.
(d) The wetland has a rectangular shape measuring 250 m by 180 m. Calculate the total area of the wetland ecosystem in m².
(e) Thabo observes the following organisms in a 50 m² section of the wetland: 25 bullfrogs, 15 water lilies, 40 dragonfly larvae, and 10 herons. Identify how many different populations are present and calculate the total number of individual organisms in this community.
(f) If the population of bullfrogs in the entire wetland is estimated at 1500 individuals, and the wetland area is as calculated in (d), determine the population density of bullfrogs in the wetland in individuals per m².
Question 12
12. Nomvula is investigating the concept of ecosystems and how they relate to the biosphere.
(a) Define the term biosphere.
(b) Explain the relationship between a population, a community, and an ecosystem.
(c) Nomvula studies three different ecosystems: a desert, a forest, and a coral reef. Explain why these ecosystems have different communities of organisms even though they are all part of the same biosphere.
(d) In the forest ecosystem, Nomvula marks out a study plot of 400 m². She counts 80 indigenous tree seedlings in this plot. Calculate the population density of tree seedlings in seedlings per m².
(e) After one year, the number of tree seedlings in the same 400 m² plot has increased to 120 seedlings. Calculate the new population density and determine by what factor the density has increased.
(f) Evaluate whether an increase in population density of one species in an ecosystem will always benefit the ecosystem as a whole. Justify your answer with reference to ecosystem interactions.
SECTION C: DATA ANALYSIS AND GRAPHING
(Total: 15 marks)
Question 13
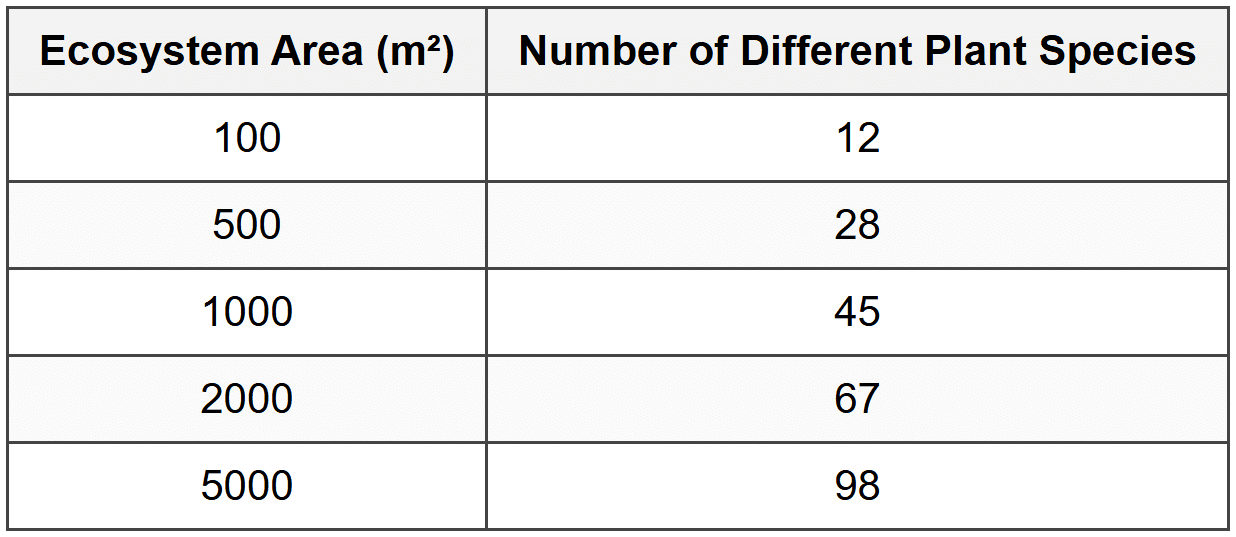
13. Sipho conducted a study on the number of plant species (biodiversity) found in different-sized ecosystems in the Eastern Cape. He recorded his findings in the table below:
(a) Identify the independent variable and the dependent variable in Sipho's investigation.
(b) Calculate the species density (number of species per 100 m²) for the ecosystem with an area of 2000 m².
(c) Describe the relationship between ecosystem area and the number of plant species observed.
(d) Sipho concludes that larger ecosystems will always support greater biodiversity than smaller ecosystems. Evaluate this conclusion by discussing one limitation of his investigation and one additional factor that might affect biodiversity besides ecosystem size.
SECTION D: SCIENTIFIC INVESTIGATION
(Total: 15 marks)
Question 14
14. Zanele wants to investigate how the amount of sunlight (abiotic factor) affects the population density of a particular grass species in different parts of a savanna ecosystem. She selects four 10 m × 10 m plots in the savanna: one in full sunlight, one in partial shade, one in deep shade under trees, and one in filtered sunlight. She counts the number of grass plants in each plot and records the average light intensity using a light meter. After counting, she finds that the plot in full sunlight has 850 grass plants, the partial shade plot has 620 plants, the deep shade plot has 180 plants, and the filtered sunlight plot has 520 plants. All plots have similar soil type, moisture levels, and are located in the same savanna ecosystem.
(a) Identify the independent variable in Zanele's investigation.
(b) Identify the dependent variable in Zanele's investigation.
(c) Name one controlled variable in this investigation and explain why it must be kept constant.
(d) Write a hypothesis for Zanele's investigation in the format: If [condition], then [expected result], because [scientific reason].
(e) Calculate the population density of grass plants in the full sunlight plot in plants per m².
(f) Based on Zanele's results, draw a conclusion about the effect of sunlight on grass population density in the savanna ecosystem. In your conclusion, state whether the hypothesis you wrote in (d) is supported by the data, and provide a scientific explanation for the pattern observed in the results.
GRAND TOTAL: 70
ANSWER KEY
Well done for completing this worksheet on Biosphere to Ecosystems! Use this answer key to check your understanding and identify areas where you can improve. Remember that understanding the concepts is more important than just memorizing answers. Keep up the excellent work!
SECTION A - Question 1
B. The part of Earth where life exists, including land, water, and air
The biosphere is the global ecosystem that includes all parts of Earth where life can exist. This encompasses the lithosphere (land), hydrosphere (water), and atmosphere (air), extending from deep ocean trenches to high mountain peaks. Option A is incorrect as it excludes the lithosphere. Option C is too narrow as it only mentions land. Option D is incorrect as it excludes animal life.
SECTION A - Question 2
C. A community of organisms interacting with each other and their physical environment
An ecosystem includes both the biotic (living) and abiotic (non-living) components and all the interactions between them. Option A describes only a population. Option B describes only the abiotic environment (habitat). Option D excludes the essential abiotic components.
SECTION A - Question 3
C. Temperature
Abiotic components are non-living factors in an ecosystem. Temperature is a physical property of the environment. Grass, bacteria, and fungi are all living organisms and therefore biotic components.
SECTION A - Question 4
B. All the organisms of one species living in a particular area at a particular time
A population is defined as all individuals of the same species occupying a specific area at a specific time. Option A describes a community. Option C is too broad and vague. Option D is too narrow and excludes animals.
SECTION A - Question 5
C. 3
Each species represents one population. Since there are three different species mentioned (impala, zebra, and wildebeest), there are three populations. The numbers given (500, 200, 50) represent the sizes of each population, not the number of populations. The total number of individuals (750) is the community size, not the number of populations.
SECTION A - Question 6
B. m²
Area is a two-dimensional measurement calculated as length × width. The SI unit for area is square metres (m²). Option A (m) is for length. Option C (m³) is for volume. Option D (m·s⁻¹) is for velocity.
SECTION A - Question 7
C. All the living organisms including fish, frogs, algae, and bacteria
A community consists of all the different populations (all species) of living organisms in an ecosystem. Option A describes only one population. Option B lists only abiotic factors. Option D includes only one trophic level and excludes consumers and decomposers.
SECTION A - Question 8
C. 3 000 000 m²
Step 1: State the formula
Area = length × width
Step 2: Substitute the given values
Area = 2000 m × 1500 m
Step 3: Calculate
Area = 3 000 000 m²
Step 4: State the final answer
The area of the forest ecosystem is 3 000 000 m²
SECTION A - Question 9
B. Ecosystems are the fundamental units that make up the biosphere
The biosphere is the sum of all ecosystems on Earth. Individual ecosystems (forests, oceans, deserts, etc.) are the component parts that together form the global biosphere. Option A is incorrect as the biosphere encompasses all ecosystems and is therefore larger. Option C is incorrect as they operate at different scales. Option D is impossible as all ecosystems exist within the biosphere by definition.
SECTION A - Question 10
C. 3 plants·m⁻²
Step 1: State the formula
Population density = Number of individuals ÷ Area
Step 2: Substitute the given values
Population density = 120 plants ÷ 40 m²
Step 3: Calculate
Population density = 3 plants·m⁻²
Step 4: State the final answer
The population density is 3 plants·m⁻²
Note: The unit must be written as plants·m⁻² following the curriculum notation rules for compound units.
SECTION B - Question 11(a)
A habitat is the specific place or environment where an organism lives, which provides all the necessary abiotic and biotic conditions for that organism's survival.
Full marks require: definition mentioning it is a place/environment where an organism lives, and reference to the conditions needed for survival.
SECTION B - Question 11(b)
Biotic factors are the living components of an ecosystem. Examples in the wetland: plants (reeds, water lilies), animals (frogs, birds, fish), bacteria, fungi.
Abiotic factors are the non-living physical and chemical components. Examples in the wetland: water, sunlight, temperature, soil, pH, oxygen concentration, minerals.
Full marks: Clear distinction between biotic (living) and abiotic (non-living), plus two valid examples of each.
SECTION B - Question 11(c)
Both biotic and abiotic factors are necessary because organisms (biotic) require physical and chemical conditions (abiotic) to survive, such as appropriate temperature, water, and nutrients. At the same time, organisms interact with and depend on each other for food, pollination, decomposition, and other ecological relationships. The abiotic factors provide the physical environment and resources, while the biotic factors create the biological interactions and energy flow. Without either component, the ecosystem cannot function properly.
Full marks: Explanation that organisms need physical/chemical conditions to survive AND organisms interact with each other, with specific examples of each type of necessity.
SECTION B - Question 11(d)
Step 1: State the formula
Area = length × width
Step 2: Substitute the given values with units
Area = 250 m × 180 m
Step 3: Show all working
Area = 45 000 m²
Step 4: State the final answer
The total area of the wetland ecosystem is 45 000 m²
Note: The answer must include the unit m². One mark would be deducted if the unit is omitted.
SECTION B - Question 11(e)
Number of different populations = 4 populations (bullfrogs, water lilies, dragonfly larvae, and herons are four different species, therefore four populations)
Total number of individual organisms:
25 + 15 + 40 + 10 = 90 individuals
Full marks: Correctly identifying 4 populations with brief justification, and correctly calculating 90 total individuals.
SECTION B - Question 11(f)
Step 1: State the formula
Population density = Number of individuals ÷ Total area
Step 2: Substitute the given values with units
Population density = 1500 bullfrogs ÷ 45 000 m²
Step 3: Show all working
Population density = 0.033 bullfrogs·m⁻²
or 3.3 × 10⁻² bullfrogs·m⁻²
Step 4: State the final answer
The population density of bullfrogs in the wetland is 0.033 bullfrogs·m⁻² or 3.3 × 10⁻² bullfrogs·m⁻²
Note: The unit must be written as bullfrogs·m⁻² using negative exponent notation. Accept reasonable rounding. One mark would be deducted if the unit is omitted or incorrectly written.
SECTION B - Question 12(a)
The biosphere is the part of Earth and its atmosphere where living organisms exist. It includes all ecosystems and extends from the deepest ocean floors to high in the atmosphere, encompassing portions of the lithosphere, hydrosphere, and atmosphere where life is found.
Full marks: Definition stating it is the part of Earth where life exists, with reference to it including land, water, and air OR lithosphere, hydrosphere, and atmosphere.
SECTION B - Question 12(b)
A population consists of all individuals of one species in a particular area. A community consists of all the different populations (all species) living and interacting in a particular area. An ecosystem includes the community plus all the abiotic (non-living) factors in that area, showing the interactions between biotic and abiotic components.
The relationship: Multiple populations → Community → Community + abiotic factors = Ecosystem
Full marks: Correct definitions of each term showing the hierarchical relationship and that ecosystem = community + abiotic factors.
SECTION B - Question 12(c)
These ecosystems have different communities because each ecosystem has different abiotic conditions (temperature, water availability, light intensity, soil type, salinity, etc.). Different organisms are adapted to different abiotic conditions. For example, desert organisms are adapted to high temperatures and low water availability, while coral reef organisms require warm, shallow, saltwater conditions with high light penetration. Forest organisms are adapted to moderate temperatures, higher rainfall, and shaded conditions. Since each set of abiotic conditions selects for organisms with specific adaptations, different ecosystems support different communities of organisms even though they are all part of the same biosphere.
Full marks: Explanation that different abiotic conditions exist in different ecosystems, different organisms are adapted to different conditions, with at least one specific example comparing adaptations across the ecosystems mentioned.
SECTION B - Question 12(d)
Step 1: State the formula
Population density = Number of individuals ÷ Area
Step 2: Substitute the given values with units
Population density = 80 seedlings ÷ 400 m²
Step 3: Show all working
Population density = 0.2 seedlings·m⁻²
Step 4: State the final answer
The population density of tree seedlings is 0.2 seedlings·m⁻²
Note: The unit must be written as seedlings·m⁻² with the negative exponent. One mark would be deducted if the unit is omitted.
SECTION B - Question 12(e)
Step 1: State the formula for new population density
Population density = Number of individuals ÷ Area
Step 2: Substitute the given values with units
New population density = 120 seedlings ÷ 400 m²
Step 3: Show all working
New population density = 0.3 seedlings·m⁻²
Step 4: State the answer
The new population density is 0.3 seedlings·m⁻²
Calculating the increase factor:
Factor = New density ÷ Original density
Factor = 0.3 seedlings·m⁻² ÷ 0.2 seedlings·m⁻²
Factor = 1.5
The population density has increased by a factor of 1.5 (or the density increased to 1.5 times the original, representing a 50% increase).
Note: Accept alternative correct expressions such as "multiplied by 1.5" or "increased by 50%".
SECTION B - Question 12(f)
No, an increase in population density of one species will not always benefit the ecosystem as a whole. While some increases might be beneficial (for example, an increase in producer population providing more food for herbivores), excessive population density of one species can have negative effects on the ecosystem.
Justification: If one species becomes too dense, it may overconsume resources, leading to depletion of food sources or habitat destruction. This can cause other species to decline or disappear, reducing biodiversity. For example, if herbivore population density increases too much, they may overgraze plants, causing soil erosion and loss of habitat for other organisms. Additionally, high population density can lead to increased disease transmission within that population, potentially spreading to other species. The ecosystem functions best when there is balance among all populations, not when one species dominates.
Full marks: Clear statement that increased density does not always benefit the ecosystem, with at least two specific negative consequences explained using ecosystem interaction concepts (competition, predation, resource depletion, disease, etc.).
Partial marks: Stating that it doesn't always benefit with only one consequence explained, or vague explanation without specific ecosystem interactions.
SECTION C - Question 13(a)
Independent variable: Ecosystem Area (measured in m²)
Dependent variable: Number of Different Plant Species
The independent variable is the one that is deliberately changed or selected by the investigator (different ecosystem sizes). The dependent variable is the one that is measured in response to the change (number of species counted).
SECTION C - Question 13(b)
Step 1: State the formula
Species density = (Number of species ÷ Ecosystem area) × 100 m²
Step 2: Substitute the given values with units
For the 2000 m² ecosystem: Number of species = 67
Species density = (67 species ÷ 2000 m²) × 100 m²
Step 3: Show all working
Species density = (0.0335 species·m⁻²) × 100 m²
Species density = 3.35 species per 100 m²
Step 4: State the final answer
The species density is 3.35 species per 100 m²
Note: Accept 3.4 species per 100 m² if rounded appropriately. The calculation shows how many species would be expected in a standardized 100 m² area.
SECTION C - Question 13(c)
There is a positive relationship between ecosystem area and the number of plant species. As the ecosystem area increases, the number of different plant species also increases. This relationship shows that larger ecosystems support greater plant biodiversity than smaller ecosystems.
Full marks: Clear description of positive/direct relationship, stating that as area increases, number of species increases, with reference to the data trend.
Partial marks: Stating that larger areas have more species without describing it as a relationship or pattern.
SECTION C - Question 13(d)
Evaluation of conclusion: Sipho's conclusion that larger ecosystems will always support greater biodiversity has some support from his data, but it is not fully justified and may be an overgeneralization.
Limitation of the investigation: Sipho only studied ecosystems in one region (Eastern Cape) and only measured plant species. The investigation does not account for different ecosystem types (desert, forest, wetland, marine) which may show different patterns. Also, the sample size is limited to only five ecosystems, which is not enough to make a universal claim. The relationship observed might not hold true for very large ecosystems or different biomes.
Additional factor affecting biodiversity besides size: Climate and rainfall patterns, soil fertility and type, altitude, human disturbance, presence of invasive species, proximity to other ecosystems (edge effects), or historical factors such as past disturbances. For example, a small ecosystem with high rainfall and fertile soil might support more species than a large desert ecosystem with poor abiotic conditions.
Full marks: Clear evaluation stating the conclusion is not fully justified, one valid limitation of the investigation method/design, and one specific additional abiotic or biotic factor that affects biodiversity with explanation.
Partial marks: Stating the conclusion is limited or partially correct, with either a limitation OR an additional factor but not both, or explanations lacking detail.
SECTION D - Question 14(a)
Independent variable: Amount of sunlight OR Light intensity
This is the variable that Zanele deliberately changed by selecting plots with different amounts of shade (full sunlight, partial shade, deep shade, filtered sunlight). The independent variable is what the investigator manipulates or selects to test its effect.
SECTION D - Question 14(b)
Dependent variable: Population density of grass plants OR Number of grass plants
This is the variable that Zanele measured in response to the different light conditions. It depends on the amount of sunlight and is the outcome being investigated.
SECTION D - Question 14(c)
Controlled variable: Soil type OR Moisture levels OR Location within the same savanna ecosystem
Explanation: This variable must be kept constant to ensure that any differences in grass population density are due only to the difference in sunlight, not to other factors. If soil type varied between plots, differences in population density might be caused by soil fertility rather than light, making the results unreliable. By keeping this variable constant, Zanele ensures a fair test where only the independent variable (sunlight) changes.
Full marks: Correctly named controlled variable from those mentioned in the scenario, with clear explanation that it must be constant to ensure fair test and that only sunlight causes any observed differences.
SECTION D - Question 14(d)
Model hypothesis: If the amount of sunlight increases, then the population density of grass plants will increase, because grass plants require sunlight for photosynthesis to produce energy for growth and reproduction, so more sunlight will support larger grass populations.
Alternative acceptable hypothesis: If grass plants receive more sunlight, then they will have higher population density, because increased light availability provides more energy through photosynthesis, enabling more individual plants to survive and grow in the ecosystem.
Full marks: Hypothesis in correct format with clear if-then-because structure, scientifically accurate reasoning linking sunlight to photosynthesis and plant survival/growth.
SECTION D - Question 14(e)
Step 1: State the formula
Population density = Number of individuals ÷ Area
Step 2: Determine the area and substitute values
Area of plot = 10 m × 10 m = 100 m²
Number of grass plants in full sunlight plot = 850 plants
Population density = 850 plants ÷ 100 m²
Step 3: Show all working
Population density = 8.5 plants·m⁻²
Step 4: State the final answer
The population density of grass plants in the full sunlight plot is 8.5 plants·m⁻²
Note: The unit must be written as plants·m⁻² with negative exponent notation. One mark would be deducted if the unit is omitted or written incorrectly.
SECTION D - Question 14(f)
Conclusion: The investigation shows that sunlight has a significant positive effect on grass population density in the savanna ecosystem. The data clearly demonstrates that plots with more sunlight support higher grass population densities. The full sunlight plot had the highest population density (850 plants in 100 m² = 8.5 plants·m⁻²), followed by partial shade (620 plants = 6.2 plants·m⁻²), then filtered sunlight (520 plants = 5.2 plants·m⁻²), and the deep shade plot had the lowest density (180 plants = 1.8 plants·m⁻²).
Hypothesis evaluation: The hypothesis is supported by the data. The hypothesis predicted that increased sunlight would lead to increased grass population density due to the requirement for photosynthesis, and the results confirm this pattern. As sunlight decreased from full sun to deep shade, the population density decreased proportionally, showing a clear positive relationship.
Scientific explanation: This pattern occurs because grass plants are autotrophs that depend on photosynthesis to convert light energy into chemical energy (glucose) for growth, reproduction, and survival. In full sunlight, grass plants receive maximum light energy, enabling them to photosynthesize efficiently, grow vigorously, and support a larger population. In deep shade, insufficient light limits photosynthesis, reducing plant growth and survival rates, resulting in much lower population density. The abiotic factor (sunlight) directly affects the ability of the biotic component (grass) to thrive, demonstrating the critical interaction between abiotic and biotic factors in ecosystem functioning.
Full marks: Clear conclusion stating the effect observed, explicit statement that hypothesis is supported with reference to specific data from at least two plots, scientific explanation linking sunlight to photosynthesis and population size, and recognition of abiotic-biotic interaction in ecosystem context.
Partial marks: Conclusion with general statement about sunlight effect, statement about hypothesis support without specific data reference, or explanation lacking the ecosystem interaction concept.
MARK ALLOCATION SUMMARY