Assignment : Marketing Analytics & Metrics


Section 1: Multiple Choice Questions
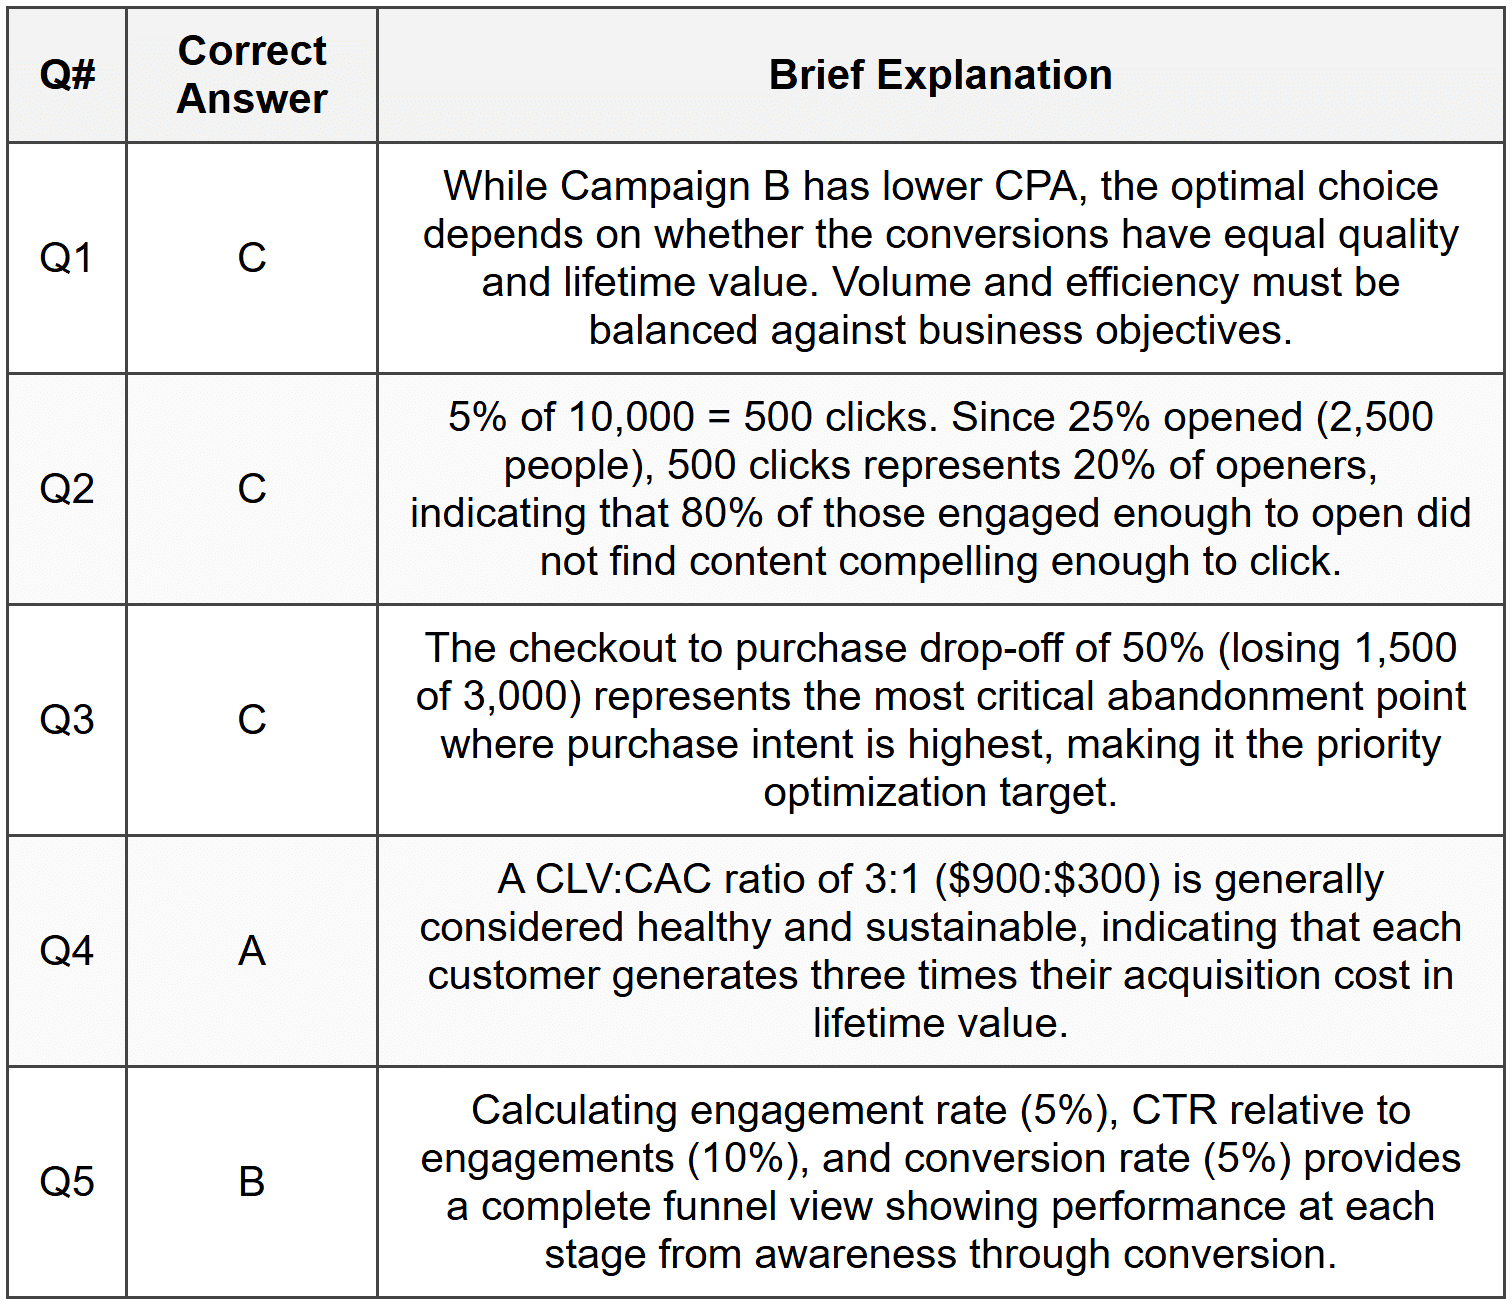
- Q1. A company runs two parallel ad campaigns with identical budgets. Campaign A generates 500 conversions at $10 CPA, while Campaign B generates 300 conversions at $8 CPA. Which statement best represents a sound analytical decision?
- Campaign A is superior because it generated more total conversions
- Campaign B is superior because of its lower cost per acquisition
- The decision depends on customer lifetime value and conversion quality metrics
- Both campaigns are equally effective since they had the same budget
- Q2. A marketing manager observes that their email campaign has a 25% open rate and a 5% click-through rate. If 10,000 emails were sent, how many recipients clicked through, and what does this indicate about engagement?
- 500 clicks; this shows strong engagement at the awareness stage
- 1,250 clicks; this indicates effective subject lines but weak content
- 500 clicks; this suggests only 20% of those who opened found the content compelling
- 2,500 clicks; this demonstrates excellent email performance across all metrics
- Q3. An e-commerce business analyzes its customer acquisition funnel and discovers: 100,000 website visitors, 10,000 added items to cart, 3,000 initiated checkout, and 1,500 completed purchases. Which stage represents the most critical drop-off point requiring immediate optimization?
- Website visitors to cart additions, with 90% drop-off rate
- Cart additions to checkout initiation, with 70% drop-off rate
- Checkout initiation to purchase completion, with 50% drop-off rate
- All stages are equally critical and should receive equal attention
- Q4. A SaaS company measures the following metrics: Customer Acquisition Cost (CAC) = $300, Average Customer Lifetime Value (CLV) = $900, and average customer lifespan = 24 months. What strategic insight does the CLV:CAC ratio provide?
- The ratio of 3:1 indicates a healthy, sustainable business model
- The company is spending too much on acquisition and should reduce marketing budget
- The 24-month lifespan is too short and must be extended before scaling acquisition
- Customer lifetime value is irrelevant if monthly recurring revenue is growing
- Q5. A brand launches a social media campaign and tracks the following: 2 million impressions, 100,000 engagements, 10,000 link clicks, and 500 conversions. The marketing team wants to evaluate campaign effectiveness. Which combination of metrics provides the most comprehensive performance picture?
- Impressions and engagements only, as they show reach and interest
- Engagement rate (5%), click-through rate (10% of engagements), and conversion rate (5% of clicks)
- Total conversions alone, since revenue generation is the ultimate goal
- Impressions and conversions only, to calculate cost per thousand impressions
Section 2: Conceptual Understanding
- Q1. Explain the difference between vanity metrics and actionable metrics in marketing analytics. Provide two examples of each and describe why distinguishing between them is critical for marketing decision-making.
- Q2. What is attribution modeling in marketing analytics? Describe the difference between first-touch and last-touch attribution, and explain a scenario where multi-touch attribution would provide more valuable insights.
- Q3. Define Return on Marketing Investment (ROMI) and explain how it differs from general ROI. Why is ROMI particularly important for justifying marketing budgets to executive leadership?
- Q4. Describe the concept of cohort analysis in marketing. How can tracking customer cohorts over time reveal insights that aggregate metrics might miss? Provide a specific use case.
Section 3: Analytical / Applied Tasks
- Q1. Complete the following marketing metrics calculation table based on the campaign data provided:
Campaign Data:
- Total Marketing Spend: $50,000
- Total Revenue Generated: $200,000
- Number of New Customers Acquired: 500
- Total Website Visitors: 25,000
- Total Conversions: 500
Calculate the following metrics and fill in your answers:
- Customer Acquisition Cost (CAC)
- Return on Marketing Investment (ROMI)
- Conversion Rate
- Revenue per Customer
- Q2. A digital marketing team is analyzing their Google Ads performance across three campaigns. Review the data and determine which campaign should receive increased budget allocation based on efficiency metrics:
Campaign Performance Data:
- Campaign X: Spend = $5,000, Conversions = 100, Revenue = $15,000
- Campaign Y: Spend = $8,000, Conversions = 200, Revenue = $20,000
- Campaign Z: Spend = $3,000, Conversions = 50, Revenue = $12,000
For each campaign, calculate:
- Cost Per Acquisition (CPA)
- Return on Ad Spend (ROAS)
- Revenue per Conversion
Based on your calculations, recommend which campaign deserves budget increase and justify your reasoning.
- Q3. Match the following marketing metrics with their primary strategic purpose:
Metrics:
- Customer Lifetime Value (CLV)
- Net Promoter Score (NPS)
- Churn Rate
- Share of Voice
- Marketing Qualified Leads (MQL)
Strategic Purposes:
- Measuring customer loyalty and likelihood to recommend
- Assessing brand visibility relative to competitors
- Predicting long-term customer profitability
- Evaluating customer retention effectiveness
- Tracking lead generation quality for sales alignment
Section 4: Case Study Analysis
Background
TechFlow, a B2B software company, invested $120,000 in a multi-channel marketing campaign over six months targeting enterprise clients. The campaign included content marketing, LinkedIn advertising, email nurture sequences, and webinar hosting. The analytics team has compiled the following data:
- Total website visitors: 45,000
- Marketing Qualified Leads (MQLs): 1,800
- Sales Qualified Leads (SQLs): 450
- Closed deals: 90
- Total revenue from new customers: $540,000
- Average deal size: $6,000
- Channel breakdown: LinkedIn (40% of MQLs), Content (35% of MQLs), Email (15% of MQLs), Webinars (10% of MQLs)
- LinkedIn spend: $50,000; Content: $30,000; Email: $20,000; Webinars: $20,000
Your Role
You are the Marketing Analytics Manager responsible for presenting campaign performance to the executive team and recommending budget allocation for the next quarter.
Questions
- Q1. Calculate the following key performance metrics for the overall campaign: (a) MQL to SQL conversion rate, (b) SQL to customer conversion rate, (c) Overall conversion rate from visitor to customer, (d) Customer Acquisition Cost, and (e) Return on Marketing Investment.
- Q2. Analyze the efficiency of each marketing channel by calculating the cost per MQL for LinkedIn, Content, Email, and Webinars. Which channel demonstrates the best cost efficiency, and what additional metric would you need to make a complete budget allocation decision?
- Q3. The executive team wants to scale customer acquisition to 150 deals next quarter. Based on your conversion rate analysis, what would be the required number of MQLs, and what projected marketing budget would be needed if efficiency remains constant?
- Q4. Identify two potential weaknesses or blind spots in the current analytics approach that could lead to suboptimal decisions. What additional metrics or data points would you recommend tracking?
Section 5: Situational Application
- Q1. You notice that your company's email marketing campaigns consistently show a 30% open rate but only a 2% click-through rate, while industry benchmarks suggest 22% open rate and 3.5% click-through rate. What specific analytical steps would you take to diagnose the issue, and what hypotheses would you test?
- Q2. A retail client wants to measure the impact of their influencer marketing campaign. They provided influencers with unique discount codes and tracked 2,000 uses generating $80,000 in revenue. However, during the campaign period, overall brand search volume increased 45% and total revenue grew 25%. How would you approach measuring the true impact of the influencer campaign beyond direct code attribution?
- Q3. Your analytics dashboard shows that mobile users have a 1.2% conversion rate while desktop users have a 3.8% conversion rate. Mobile traffic represents 65% of total visitors. The marketing director suggests reducing mobile advertising spend. Do you agree with this recommendation? Justify your position with analytical reasoning and propose alternative actions.
Answer Key
Section 1 - MCQ Answers
Section 2 Answers
Q1. Vanity metrics are measurements that look impressive but do not directly inform business decisions or correlate with meaningful outcomes, such as total page views or social media follower count. Actionable metrics directly tie to business objectives and enable decision-making, such as conversion rate or customer acquisition cost. For example, having 100,000 social media followers (vanity) is less valuable than knowing that social media drives a 4% conversion rate and $50 CAC (actionable). Distinguishing between them is critical because optimizing vanity metrics can waste resources on activities that do not drive revenue or business growth, while actionable metrics guide strategic resource allocation.
Q2. Attribution modeling is the process of determining which marketing touchpoints receive credit for a conversion or sale. First-touch attribution assigns 100% credit to the initial touchpoint where a customer first interacted with the brand, while last-touch attribution gives all credit to the final interaction before conversion. Multi-touch attribution would be more valuable in complex B2B sales cycles where customers might first discover a brand through content marketing, engage via multiple email touchpoints, attend a webinar, and finally convert through a sales call. In this scenario, single-touch models would misrepresent the contribution of middle-funnel activities that were essential to moving the prospect toward purchase.
Q3. Return on Marketing Investment (ROMI) specifically measures the revenue or profit generated from marketing activities relative to marketing spend, typically calculated as (Revenue from Marketing - Marketing Cost) / Marketing Cost. Unlike general ROI which measures returns on any investment, ROMI isolates marketing effectiveness and often focuses on incremental revenue directly attributable to marketing efforts. ROMI is particularly important for justifying marketing budgets to executives because it demonstrates marketing's direct contribution to revenue generation in financial terms that leadership uses to evaluate all business investments, making it easier to secure budget increases or defend existing allocations against competing priorities.
Q4. Cohort analysis groups customers based on a shared characteristic or experience within a defined time period (such as acquisition month) and tracks their behavior over time. This reveals insights aggregate metrics miss by showing how customer behavior patterns differ across groups and evolve over time. For example, a SaaS company might discover that customers acquired in January have a 75% 12-month retention rate while March cohorts have only 55% retention, despite overall retention appearing stable at 65%. This insight would prompt investigation into what differed about March acquisition strategies or customer quality, enabling targeted improvements that aggregate metrics would obscure.
Section 3 Answers
Q1. Metric Calculations:
Customer Acquisition Cost (CAC) = Total Marketing Spend ÷ Number of New Customers
CAC = $50,000 ÷ 500 = $100 per customer
Return on Marketing Investment (ROMI) = (Revenue - Marketing Spend) ÷ Marketing Spend × 100
ROMI = ($200,000 - $50,000) ÷ $50,000 × 100 = 300%
Conversion Rate = (Total Conversions ÷ Total Website Visitors) × 100
Conversion Rate = (500 ÷ 25,000) × 100 = 2%
Revenue per Customer = Total Revenue ÷ Number of Customers
Revenue per Customer = $200,000 ÷ 500 = $400
Q2. Campaign Performance Analysis:
Campaign X:
CPA = $5,000 ÷ 100 = $50
ROAS = $15,000 ÷ $5,000 = 3.0 or 300%
Revenue per Conversion = $15,000 ÷ 100 = $150
Campaign Y:
CPA = $8,000 ÷ 200 = $40
ROAS = $20,000 ÷ $8,000 = 2.5 or 250%
Revenue per Conversion = $20,000 ÷ 200 = $100
Campaign Z:
CPA = $3,000 ÷ 50 = $60
ROAS = $12,000 ÷ $3,000 = 4.0 or 400%
Revenue per Conversion = $12,000 ÷ 50 = $240
Recommendation: Campaign Z should receive increased budget allocation. Despite having the highest CPA ($60), it delivers the highest ROAS (400%) and highest revenue per conversion ($240), indicating it attracts higher-value customers. Campaign X is also efficient with strong ROAS (300%), making it a secondary candidate for scaling. Campaign Y, while having the lowest CPA, generates the lowest revenue per customer, suggesting it may attract lower-value conversions.
Q3. Metric-Purpose Matching:
- A - Customer Lifetime Value (CLV) → 3 - Predicting long-term customer profitability
- B - Net Promoter Score (NPS) → 1 - Measuring customer loyalty and likelihood to recommend
- C - Churn Rate → 4 - Evaluating customer retention effectiveness
- D - Share of Voice → 2 - Assessing brand visibility relative to competitors
- E - Marketing Qualified Leads (MQL) → 5 - Tracking lead generation quality for sales alignment
Section 4 - Case Study Answers
Q1. Key Performance Metrics Calculations:
(a) MQL to SQL conversion rate = (450 ÷ 1,800) × 100 = 25%
(b) SQL to customer conversion rate = (90 ÷ 450) × 100 = 20%
(c) Overall visitor to customer conversion rate = (90 ÷ 45,000) × 100 = 0.2%
(d) Customer Acquisition Cost = $120,000 ÷ 90 = $1,333.33
(e) Return on Marketing Investment = ($540,000 - $120,000) ÷ $120,000 × 100 = 350%
Q2. Channel Efficiency Analysis:
LinkedIn: 40% of 1,800 MQLs = 720 MQLs; Cost per MQL = $50,000 ÷ 720 = $69.44
Content: 35% of 1,800 = 630 MQLs; Cost per MQL = $30,000 ÷ 630 = $47.62
Email: 15% of 1,800 = 270 MQLs; Cost per MQL = $20,000 ÷ 270 = $74.07
Webinars: 10% of 1,800 = 180 MQLs; Cost per MQL = $20,000 ÷ 180 = $111.11
Content marketing demonstrates the best cost efficiency at $47.62 per MQL. However, to make a complete budget allocation decision, we need the MQL-to-customer conversion rate by channel. It is possible that webinars, despite higher cost per MQL, generate higher-quality leads that convert at superior rates, making their overall CAC competitive or even better than lower-cost channels.
Q3. Scaling Projection:
Current SQL to customer conversion rate is 20%, so to achieve 150 customers requires:
Required SQLs = 150 ÷ 0.20 = 750 SQLs
Current MQL to SQL conversion rate is 25%, so to achieve 750 SQLs requires:
Required MQLs = 750 ÷ 0.25 = 3,000 MQLs
Current cost per MQL across all channels = $120,000 ÷ 1,800 = $66.67
Projected marketing budget = 3,000 × $66.67 = $200,000
This assumes conversion rates and cost efficiency remain constant at scale, which may not hold true and should be monitored closely.
Q4. Analytical Weaknesses and Recommendations:
Weakness 1: The current analysis does not track Customer Lifetime Value (CLV) or differentiate customer quality across channels. A channel might have higher CAC but acquire customers with significantly higher long-term value, making it more valuable than the CAC metric alone suggests.
Weakness 2: There is no multi-touch attribution analysis. The channel breakdown shows which channel generated the MQL, but in B2B marketing, customers typically interact with multiple touchpoints. A webinar might get last-touch credit, but the prospect may have been nurtured through content and email first.
Additional Metrics Recommended: (1) Customer Lifetime Value by acquisition channel, (2) Time-to-conversion by channel, (3) Multi-touch attribution modeling to understand channel interaction effects, (4) Lead quality scores or MQL-to-customer conversion rates by channel, and (5) Customer retention/churn rates by acquisition channel.
Section 5 Answers
Q1. The data reveals an unusual pattern: above-benchmark open rates but below-benchmark click-through rates, suggesting strong subject lines but weak email content or relevance. Analytical steps would include: (1) Segment analysis-compare CTR across customer segments, email types, and time periods to identify if the issue is universal or specific; (2) Content analysis-review email body content, call-to-action placement, link visibility, and message-offer alignment; (3) A/B testing-test different content structures, CTA designs, personalization levels, and value propositions; (4) Heat map analysis-if available, review where recipients click or scroll within emails. Hypotheses to test include: CTAs are not compelling or visible enough, email content does not deliver on subject line promises (creating disappointment), offers are not relevant to segmented audiences, or there are too many competing links diluting click focus.
Q2. Measuring true influencer impact requires moving beyond last-touch direct attribution to capture broader brand and awareness effects. The approach should include: (1) Incrementality testing-compare revenue and metrics during campaign period versus equivalent prior period, controlling for seasonality; (2) Brand lift measurement-the 45% increase in brand search volume likely indicates influencer-driven awareness that led to conversions through other channels; (3) Multi-touch attribution modeling-analyze customer journeys to identify how many conversions involved influencer exposure earlier in the funnel even if they did not use the code; (4) Survey attribution-ask new customers how they discovered the brand; (5) Calculate assisted conversions where influencer content was part of the path to purchase. A comprehensive view might reveal that while $80,000 is directly attributed, the influencers contributed to a significant portion of the overall 25% revenue growth through awareness and consideration-stage influence.
Q3. I would not agree with reducing mobile advertising spend based solely on lower conversion rates. This recommendation ignores the volume-efficiency tradeoff and potential strategic opportunities. Analytical reasoning: Mobile represents 65% of traffic, so despite lower conversion rate (1.2% vs 3.8%), mobile may still drive substantial absolute conversions. If total visitors are 100,000, mobile generates 780 conversions (65,000 × 1.2%) while desktop generates 133 conversions (35,000 × 3.8%), meaning mobile drives significantly more total conversions. Alternative actions: (1) Optimize mobile user experience-the conversion gap likely indicates UX friction on mobile (forms, checkout, page load speed); (2) Analyze mobile user intent and journey-mobile users may research on mobile and convert on desktop later (cross-device tracking needed); (3) Implement mobile-specific campaigns with appropriate conversion goals (call clicks, store visits, app downloads) rather than treating mobile identically to desktop; (4) Calculate full-funnel mobile contribution using multi-device attribution before making budget decisions.