Chapter Notes: Two-Way Tables


Organizing data helps us see patterns and make better decisions. When we want to understand how two different categories relate to each other, a simple list of numbers can be confusing. Two-way tables (also called contingency tables) are powerful tools that organize data by showing two categorical variables at once. They help us answer questions like "Do students who play sports tend to have different study habits than those who don't?" or "Is there a relationship between gender and favorite type of movie?" Learning to read and create two-way tables will help you analyze surveys, experiments, and real-world data with confidence.
What Is a Two-Way Table?
A two-way table is a table that displays counts or frequencies for two categorical variables. One variable is shown in the rows, and the other is shown in the columns. Each cell in the table shows how many observations fall into both categories at once.
Think of a two-way table like a checkerboard where each square tells you how many items belong to both a specific row category and a specific column category.
The table usually includes marginal totals, which are the row and column totals. These totals appear in the margins (edges) of the table and show the total count for each individual category.
Structure of a Two-Way Table
Every two-way table has these key components:
- Row variable: The categorical variable displayed along the left side of the table
- Column variable: The categorical variable displayed across the top of the table
- Cells: The interior boxes that contain counts or frequencies
- Row totals: Sums of all values in each row, shown on the right margin
- Column totals: Sums of all values in each column, shown on the bottom margin
- Grand total: The total number of observations, shown in the bottom-right corner
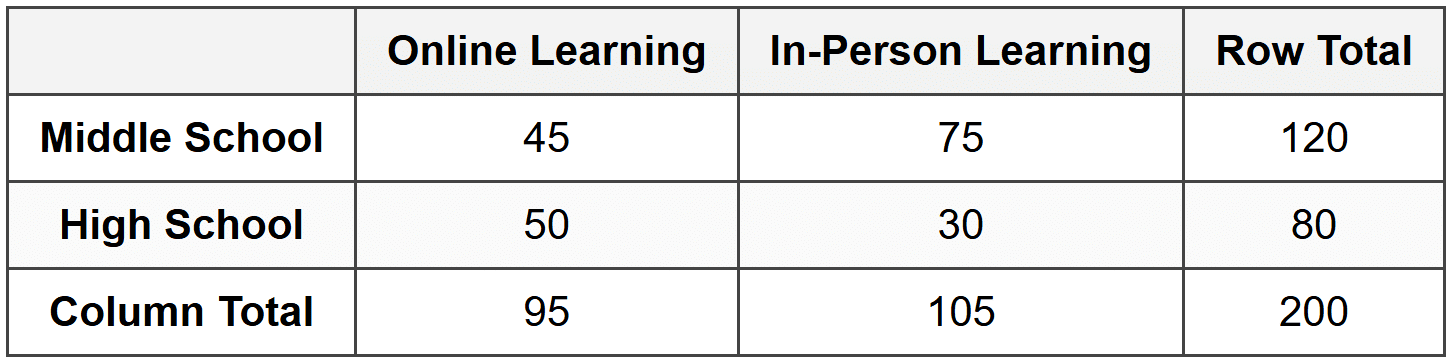
Example: A survey asked 200 students whether they prefer online learning or in-person learning.
The results also recorded whether each student was in middle school or high school.What would the two-way table look like?
Solution:
The table shows that 45 middle school students prefer online learning, 75 middle school students prefer in-person learning, 50 high school students prefer online learning, and 30 high school students prefer in-person learning. The grand total is 200 students.
Reading and Interpreting Two-Way Tables
Once you have a two-way table, you can extract many different pieces of information. You can answer questions about individual categories, compare groups, and identify patterns.
Finding Specific Values
To find the count for a specific combination of categories, locate the row and column that match your criteria, then read the value in the cell where they intersect.
Example: Using the table from the previous example, how many high school students prefer in-person learning?
Solution:
Find the row labeled "High School" and the column labeled "In-Person Learning."
The cell where they meet contains the number 30.
Therefore, 30 high school students prefer in-person learning.
Using Marginal Totals
The marginal totals tell you how many observations belong to each individual category, ignoring the other variable. Row totals show the total for each row category, and column totals show the total for each column category.
Example: Using the same table, how many students in total prefer online learning?
Solution:
Look at the column total under "Online Learning."
The column total is 95.
This means 95 students in total prefer online learning, regardless of whether they are in middle school or high school.
Creating a Two-Way Table from Data
When you collect raw data, you often need to organize it into a two-way table yourself. This process involves counting how many observations fall into each combination of categories.
Steps to Create a Two-Way Table
- Identify the two categorical variables you want to compare
- List all categories for the first variable as rows
- List all categories for the second variable as columns
- Count how many observations belong to each combination of row and column
- Fill in each cell with the correct count
- Calculate row totals by adding across each row
- Calculate column totals by adding down each column
- Calculate the grand total (sum of all observations)
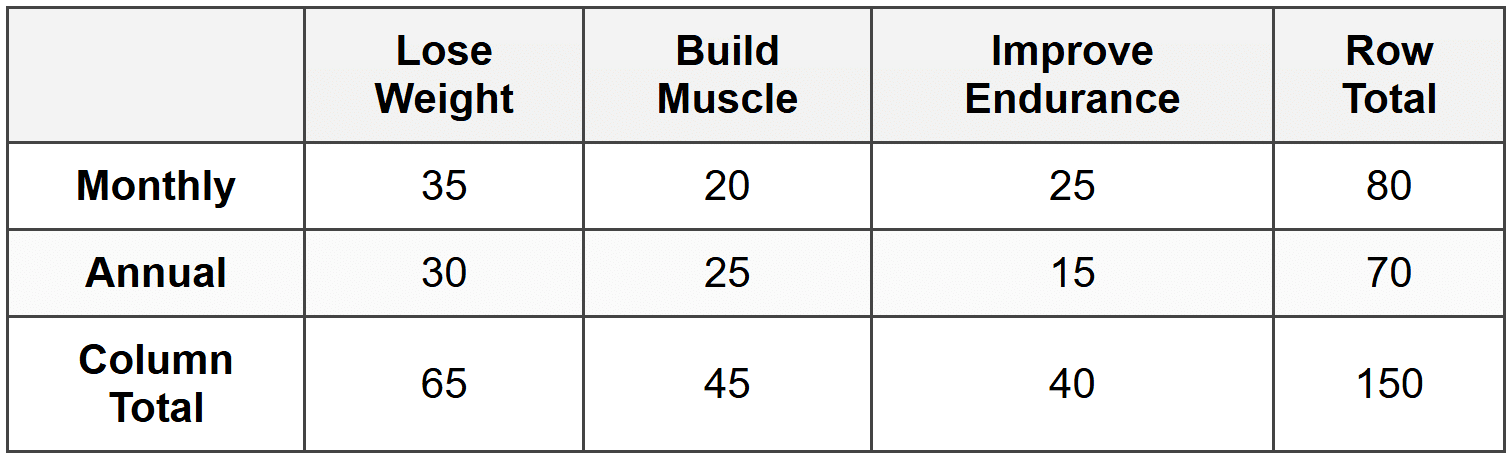
Example: A gym surveyed 150 members about their primary workout goal (lose weight, build muscle, or improve endurance) and their membership type (monthly or annual).
The raw data showed: 35 monthly members want to lose weight, 20 monthly members want to build muscle, 25 monthly members want to improve endurance, 30 annual members want to lose weight, 25 annual members want to build muscle, and 15 annual members want to improve endurance.Create a two-way table to organize this data.
Solution:
Set up the table with membership type as rows and workout goal as columns.
Row totals: 35 + 20 + 25 = 80 monthly members; 30 + 25 + 15 = 70 annual members.
Column totals: 35 + 30 = 65 want to lose weight; 20 + 25 = 45 want to build muscle; 25 + 15 = 40 want to improve endurance.
The grand total is 150 members.
Calculating Relative Frequencies
While counts are useful, sometimes we want to know what fraction or percentage of the data falls into each category. Relative frequency is the ratio of the count in a category to the total number of observations. We can calculate relative frequencies for the entire table, for rows, or for columns.
Joint Relative Frequency
Joint relative frequency is the ratio of the count in a specific cell to the grand total. It tells you what fraction of all observations belong to that particular combination of categories.
\[ \text{Joint Relative Frequency} = \frac{\text{Cell Count}}{\text{Grand Total}} \]Example: Using the gym data, what is the joint relative frequency of monthly members who want to build muscle?
Solution:
The cell count for monthly members who want to build muscle is 20.
The grand total is 150.
Joint relative frequency = 20 ÷ 150 = 0.133... ≈ 0.133
As a percentage: 0.133 × 100% ≈ 13.3%
Approximately 13.3% of all gym members are monthly members who want to build muscle.
Marginal Relative Frequency
Marginal relative frequency is the ratio of a row total or column total to the grand total. It tells you what fraction of all observations belong to a single category, ignoring the other variable.
\[ \text{Marginal Relative Frequency} = \frac{\text{Row or Column Total}}{\text{Grand Total}} \]Example: What is the marginal relative frequency of members who want to improve endurance?
Solution:
The column total for "Improve Endurance" is 40.
The grand total is 150.
Marginal relative frequency = 40 ÷ 150 = 0.267 ≈ 0.267
As a percentage: 0.267 × 100% ≈ 26.7%
Approximately 26.7% of all gym members want to improve endurance.
Conditional Relative Frequency
Conditional relative frequency is the ratio of a cell count to its row total or column total. It tells you what fraction of a specific subgroup belongs to another category. We use conditional relative frequency when we want to compare groups or see if there's a relationship between variables.
\[ \text{Conditional Relative Frequency (by row)} = \frac{\text{Cell Count}}{\text{Row Total}} \] \[ \text{Conditional Relative Frequency (by column)} = \frac{\text{Cell Count}}{\text{Column Total}} \]Example: What percentage of annual members want to lose weight?
Solution:
We need the conditional relative frequency by row (since we're focusing on annual members).
The cell count for annual members who want to lose weight is 30.
The row total for annual members is 70.
Conditional relative frequency = 30 ÷ 70 ≈ 0.429
As a percentage: 0.429 × 100% ≈ 42.9%
Approximately 42.9% of annual members want to lose weight.
Using Two-Way Tables to Identify Associations
One of the most important uses of two-way tables is to determine whether there is an association (or relationship) between two categorical variables. If the variables are independent, knowing the value of one variable doesn't help you predict the other. If they are associated, the distribution of one variable changes depending on the value of the other.
Comparing Conditional Relative Frequencies
To check for an association, compare the conditional relative frequencies across different groups. If the percentages are very different, there's likely an association. If they're similar, the variables may be independent.
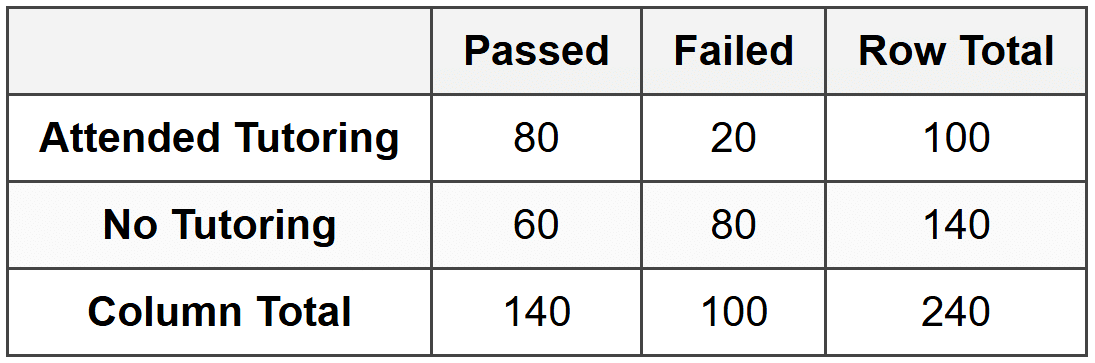
Example: A school recorded whether 240 students passed or failed a math test, and whether they attended tutoring sessions.
The data showed: 80 students attended tutoring and passed, 20 attended tutoring and failed, 60 did not attend tutoring and passed, and 80 did not attend tutoring and failed.Is there an association between attending tutoring and passing the test?
Solution:
First, create the two-way table:
Calculate conditional relative frequencies by row:
For students who attended tutoring: 80 ÷ 100 = 0.80 = 80% passed
For students who did not attend tutoring: 60 ÷ 140 ≈ 0.429 = 42.9% passed
Since 80% is much greater than 42.9%, there is a strong association between attending tutoring and passing the test. Students who attended tutoring had a much higher pass rate.
Creating Relative Frequency Tables
Sometimes it's helpful to convert an entire two-way table into relative frequencies. This makes it easier to compare proportions and spot patterns, especially when comparing tables with different total counts.
Joint Relative Frequency Table
A joint relative frequency table shows each cell as a proportion of the grand total. Every cell value is divided by the grand total, and all the values in the table add up to 1.00 (or 100%).
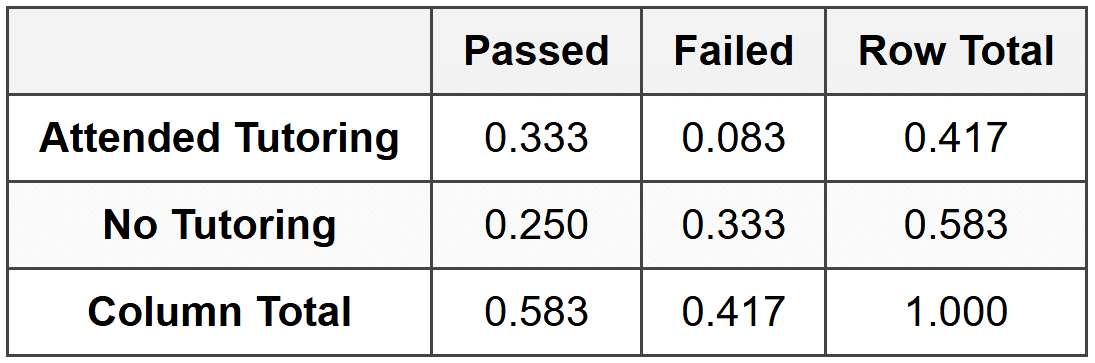
Example: Convert the tutoring data into a joint relative frequency table.
Solution:
Divide each cell by the grand total (240):
For example: 80 ÷ 240 ≈ 0.333; 20 ÷ 240 ≈ 0.083; 60 ÷ 240 = 0.250; 80 ÷ 240 ≈ 0.333
The table now shows proportions of the entire data set, and all values sum to 1.000.
Conditional Relative Frequency Table
A conditional relative frequency table shows proportions within each row (or each column). To create one by rows, divide each cell by its row total. Each row will then sum to 1.00. To create one by columns, divide each cell by its column total, so each column sums to 1.00.
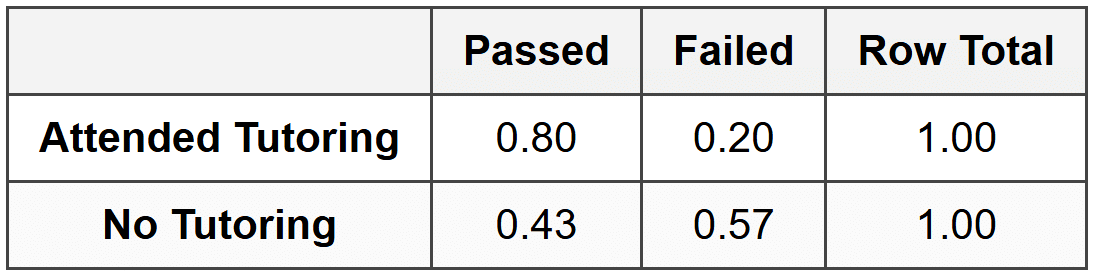
Example: Create a conditional relative frequency table by rows for the tutoring data.
Solution:
Divide each cell by its row total:
For the first row: 80 ÷ 100 = 0.80 and 20 ÷ 100 = 0.20
For the second row: 60 ÷ 140 ≈ 0.43 and 80 ÷ 140 ≈ 0.57
Each row now sums to 1.00, making it easy to compare the pass rates between the two groups.
Practical Applications of Two-Way Tables
Two-way tables are widely used in many fields because they make complex data easier to understand and analyze.
Survey Analysis
Market researchers, pollsters, and social scientists use two-way tables to understand how different groups respond to questions. For example, a company might want to know if product preference varies by age group or geographic region.
Medical Studies
Doctors and researchers use two-way tables to study the effectiveness of treatments. They might compare whether patients who received a new drug had better outcomes than those who received a placebo.
Education
Schools and districts analyze student performance using two-way tables. They can compare test scores by gender, grade level, or participation in programs like tutoring or extracurricular activities.
Sports and Gaming
Coaches and analysts use two-way tables to track player statistics. They might examine whether a basketball player's shooting percentage differs when playing at home versus away games.
Common Mistakes and How to Avoid Them
When working with two-way tables, students often make a few predictable errors. Being aware of these will help you avoid them.
Confusing Totals
Make sure you use the correct total when calculating relative frequencies. For joint relative frequency, use the grand total. For marginal relative frequency, use the grand total. For conditional relative frequency, use the appropriate row or column total.
Misreading the Table
Always double-check that you're reading the correct row and column intersection. It's easy to accidentally shift one cell over or down.
Forgetting to Check Your Work
When creating a two-way table, verify that your row totals and column totals match. The sum of all row totals should equal the sum of all column totals, and both should equal the grand total.
Assuming Association Means Causation
Just because two variables are associated doesn't mean one causes the other. There could be other factors at play. For example, students who attend tutoring might pass more often, but it could also be that students who are more motivated both attend tutoring and study harder on their own.
Summary of Key Concepts
Two-way tables are essential tools for organizing and analyzing categorical data involving two variables. They allow you to see counts, calculate proportions, and identify relationships between categories. Here are the most important ideas to remember:
- A two-way table displays data for two categorical variables, with one variable in rows and the other in columns
- Marginal totals appear in the margins and show totals for individual categories
- The grand total is the total number of observations
- Joint relative frequency compares a cell count to the grand total
- Marginal relative frequency compares a row or column total to the grand total
- Conditional relative frequency compares a cell count to its row or column total
- Comparing conditional relative frequencies helps identify associations between variables
- Two-way tables are used in surveys, research, education, medicine, and many other fields
Mastering two-way tables will give you powerful skills for understanding data in school, in your future career, and in everyday life. Whether you're analyzing survey results, comparing groups, or making decisions based on evidence, two-way tables provide a clear and organized way to see the whole picture.


