Chapter Notes: Z-Scores


In everyday life, numbers take on meaning only when we have something to compare them to. Imagine you score 85 on a test. Is that good? Without knowing how your classmates performed, it's hard to say. If most students scored around 90, your 85 might be below average. But if most students scored around 70, your 85 is excellent! Z-scores are a powerful tool that let us answer this question precisely. A z-score tells us how many standard deviations a particular value is away from the mean. This transforms any data value into a standardized form that we can compare across different datasets, different scales, and different contexts.
Understanding the Concept of a Z-Score
A z-score (also called a standard score) measures how far a data value is from the mean, expressed in units of standard deviation. Think of the standard deviation as a ruler that measures spread. The z-score tells us how many "ruler lengths" we are away from the center (the mean).
The formula for calculating a z-score is:
\[ z = \frac{x - \mu}{\sigma} \]Where:
- z is the z-score
- x is the data value we're examining
- μ (mu) is the mean of the dataset
- σ (sigma) is the standard deviation of the dataset
The numerator \( x - \mu \) tells us the distance from the mean. The denominator \( \sigma \) standardizes that distance by dividing by the standard deviation. This converts the raw distance into a number of standard deviations.
Interpreting Z-Scores
Z-scores can be positive, negative, or zero:
- z = 0: The data value equals the mean exactly.
- z > 0: The data value is above the mean. For example, z = 2 means the value is 2 standard deviations above the mean.
- z <> The data value is below the mean. For example, z = -1.5 means the value is 1.5 standard deviations below the mean.
Think of the mean as sea level. A positive z-score means you're above sea level (on a mountain), and a negative z-score means you're below sea level (in a valley). The magnitude tells you how far up or down you are.
Why Z-Scores Matter
Z-scores allow us to:
- Compare values from different datasets: Even if one dataset measures height in centimeters and another measures test scores, z-scores put both on the same scale.
- Identify unusual values: Values with z-scores greater than 3 or less than -3 are often considered outliers.
- Calculate probabilities: For normally distributed data, z-scores connect directly to probabilities through the standard normal distribution.
- Standardize data: Converting all values to z-scores creates a dataset with mean 0 and standard deviation 1.
Calculating Z-Scores
To calculate a z-score, follow these steps:
- Identify the data value \( x \) you want to convert.
- Find the mean \( \mu \) of the dataset.
- Find the standard deviation \( \sigma \) of the dataset.
- Subtract the mean from the data value: \( x - \mu \).
- Divide the result by the standard deviation: \( \frac{x - \mu}{\sigma} \).
Example: A student scores 78 on a math test.
The class mean is 70, and the standard deviation is 5.What is the student's z-score?
Solution:
Given: x = 78, μ = 70, σ = 5
Calculate the difference from the mean:
x - μ = 78 - 70 = 8Divide by the standard deviation:
z = 8 ÷ 5 = 1.6The student's z-score is 1.6.
This means the student scored 1.6 standard deviations above the class mean.
Example: A basketball player scores 12 points in a game.
The team's average points per player per game is 15, with a standard deviation of 4.Find the z-score for this player's performance.
Solution:
Given: x = 12, μ = 15, σ = 4
Calculate the difference from the mean:
x - μ = 12 - 15 = -3Divide by the standard deviation:
z = -3 ÷ 4 = -0.75The z-score is -0.75.
This player scored 0.75 standard deviations below the team average.
Using Z-Scores to Compare Different Distributions
One of the most powerful applications of z-scores is comparing values from completely different contexts. Because z-scores are dimensionless (they have no units), they provide a common scale for comparison.
Example: Sarah scored 650 on the math section of a standardized test (mean = 500, standard deviation = 100).
She scored 28 on the science section of a different test (mean = 22, standard deviation = 3).On which test did Sarah perform better relative to other students?
Solution:
Calculate the z-score for the math test:
zmath = (650 - 500) ÷ 100 = 150 ÷ 100 = 1.5Calculate the z-score for the science test:
zscience = (28 - 22) ÷ 3 = 6 ÷ 3 = 2.0Compare the z-scores:
Since 2.0 > 1.5, the science z-score is higher.Sarah performed better on the science test relative to other students, even though the raw scores are on completely different scales.
Converting Z-Scores Back to Data Values
Sometimes we know the z-score and want to find the original data value. We can rearrange the z-score formula to solve for \( x \):
\[ x = \mu + z\sigma \]This formula says: start at the mean, then move \( z \) standard deviations away. If \( z \) is positive, move above the mean. If \( z \) is negative, move below the mean.
Example: The heights of adult women are normally distributed with a mean of 65 inches and a standard deviation of 3 inches.
A woman has a z-score of 1.2 for her height.What is her actual height?
Solution:
Given: μ = 65, σ = 3, z = 1.2
Use the formula x = μ + zσ
Substitute the values:
x = 65 + (1.2)(3)
x = 65 + 3.6
x = 68.6 inchesHer height is 68.6 inches.
Example: On a college entrance exam, the mean score is 1000 with a standard deviation of 150.
A student's z-score is -0.8.What was the student's actual score?
Solution:
Given: μ = 1000, σ = 150, z = -0.8
Use the formula x = μ + zσ
Substitute the values:
x = 1000 + (-0.8)(150)
x = 1000 + (-120)
x = 1000 - 120
x = 880The student's score was 880.
The Empirical Rule and Z-Scores
For data that is approximately normally distributed, the Empirical Rule (also called the 68-95-99.7 Rule) provides a quick way to interpret z-scores:
- About 68% of data values have z-scores between -1 and 1
- About 95% of data values have z-scores between -2 and 2
- About 99.7% of data values have z-scores between -3 and 3
This is like saying that most values cluster within 1 standard deviation of the mean, almost all values are within 2 standard deviations, and virtually everything is within 3 standard deviations.
Any value with a z-score outside the range of -3 to 3 is quite unusual and may be considered an outlier.
Identifying Outliers Using Z-Scores
A common rule of thumb in statistics is that a data value is considered an outlier if:
- Its z-score is greater than 3, or
- Its z-score is less than -3
This means the value is more than 3 standard deviations away from the mean, which happens very rarely in normally distributed data (only about 0.3% of the time).
Example: A factory produces bolts with a mean length of 5.0 cm and a standard deviation of 0.1 cm.
One bolt measures 5.4 cm.Is this bolt an outlier?
Solution:
Given: x = 5.4, μ = 5.0, σ = 0.1
Calculate the z-score:
z = (5.4 - 5.0) ÷ 0.1 = 0.4 ÷ 0.1 = 4Compare to the outlier threshold:
Since z = 4 > 3, this value exceeds the threshold.This bolt is an outlier because its z-score of 4 indicates it is 4 standard deviations above the mean.
Z-Scores and the Standard Normal Distribution
When data follows a normal distribution, z-scores have a special property: they follow the standard normal distribution. This is a normal distribution with mean 0 and standard deviation 1.
The standard normal distribution is so important that statisticians have created tables (called z-tables) that show the probability of getting a z-score less than any given value. These tables allow us to answer probability questions.
Reading a Z-Table
A z-table typically shows the area (probability) to the left of a given z-score under the standard normal curve. The table is organized with:
- The first column showing the z-score to one decimal place
- The top row showing the second decimal place
- The body of the table showing probabilities
For example, to find the probability associated with z = 1.23:
- Find 1.2 in the leftmost column
- Find 0.03 in the top row
- The intersection gives the probability
Most z-tables show that approximately 89% of values fall below z = 1.23.
Common Z-Score Probabilities
Some frequently used z-scores and their associated probabilities include:
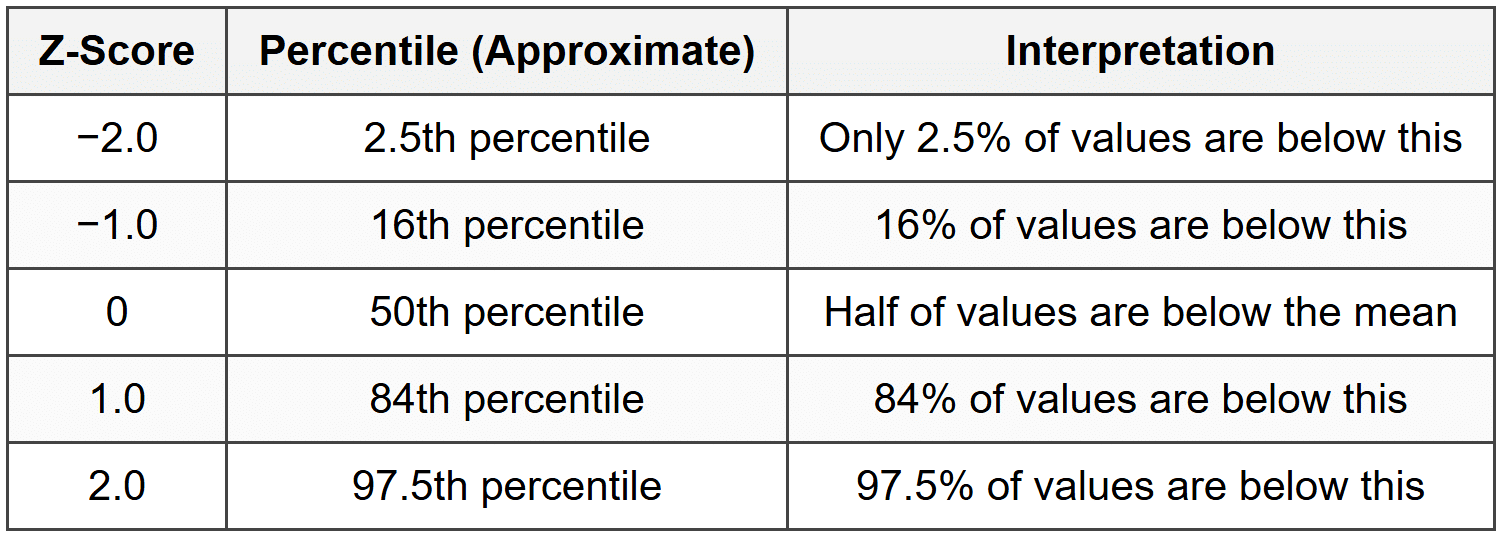
Practical Applications of Z-Scores
Educational Testing
Standardized tests often report scores as percentiles, which are calculated using z-scores. If a student scores at the 90th percentile, it means their z-score corresponds to a position where 90% of students scored below them.
Quality Control in Manufacturing
Manufacturers use z-scores to monitor product quality. If a measurement has a z-score beyond certain limits (often ±2 or ±3), the production process may be flagged for inspection.
Medical and Health Sciences
Growth charts for children use z-scores (sometimes called standard deviation scores) to assess whether a child's height or weight is typical for their age. A z-score of -2 might indicate the child is smaller than 95% of children their age.
Finance and Economics
Investors use z-scores to identify stocks that are unusually undervalued or overvalued compared to historical patterns. Economic indicators are often standardized using z-scores to compare across different time periods or regions.
Important Properties of Z-Scores
The Mean of All Z-Scores is Always Zero
When you convert every value in a dataset to z-scores, the mean of those z-scores will always be 0. This happens because z-scores measure distance from the mean, and positive distances exactly balance negative distances.
The Standard Deviation of All Z-Scores is Always One
Similarly, when you convert every value to z-scores, the standard deviation of those z-scores will always be 1. This is the purpose of dividing by σ in the z-score formula-it standardizes the spread.
Z-Scores Preserve Relative Position
If value A is larger than value B in the original data, then the z-score of A will be larger than the z-score of B. Converting to z-scores doesn't change the ordering of values.
Limitations and Considerations
While z-scores are extremely useful, they have important limitations:
- They work best with normally distributed data: If data is severely skewed or has multiple peaks, z-scores may be misleading. The Empirical Rule only applies to approximately normal distributions.
- They are sensitive to outliers: Because the standard deviation is affected by extreme values, a few outliers can distort all z-scores in a dataset.
- They require knowing the population parameters: The formula requires the true mean μ and standard deviation σ. In practice, we often use sample statistics (x̄ and s) as estimates, which introduces some uncertainty.
- They don't work for all data types: Z-scores are designed for quantitative (numerical) data. They don't apply to categorical data like favorite colors or political affiliations.
Sample vs. Population Z-Scores
When working with a sample rather than an entire population, we modify the z-score formula slightly:
\[ z = \frac{x - \bar{x}}{s} \]Where:
- x̄ (x-bar) is the sample mean
- s is the sample standard deviation
This is technically called a standard score rather than a true z-score, but in practice, many statisticians use the terms interchangeably when the sample is reasonably large.
Example: A sample of 50 cars shows a mean fuel efficiency of 28 mpg with a sample standard deviation of 4 mpg.
One car gets 35 mpg.What is the standardized score for this car?
Solution:
Given: x = 35, x̄ = 28, s = 4
Calculate using the sample formula:
z = (35 - 28) ÷ 4 = 7 ÷ 4 = 1.75The standardized score is 1.75.
This car's fuel efficiency is 1.75 standard deviations above the sample mean.
Z-scores are foundational tools in statistics that allow us to standardize data, make comparisons across different scales, and calculate probabilities. By expressing how far a value is from the mean in units of standard deviation, z-scores transform raw data into a universal language that statisticians use to draw meaningful conclusions about the world around us.
