Chapter Notes: Study Design


Every day, researchers, scientists, and decision-makers collect data to answer important questions. Whether investigating if a new medication works, testing which study method helps students perform best, or determining which ad campaign attracts more customers, the way we collect data profoundly influences the validity of our conclusions. Study design refers to the plan and structure used to collect data in a way that allows us to draw meaningful and accurate conclusions. A well-designed study minimizes bias, controls for confounding variables, and ensures that results can be trusted. In this chapter, we explore the major types of studies, their strengths and limitations, and how to interpret results responsibly.
Observational Studies vs. Experiments
When researchers want to investigate a question, they must choose between two broad categories of study design: observational studies and experiments. Understanding the difference between these two approaches is fundamental to interpreting statistical results correctly.
Observational Studies
An observational study is a study in which researchers observe and record data without intervening or manipulating any variables. Researchers simply watch what happens naturally and collect information. In observational studies, the researcher does not assign treatments or conditions to participants; instead, participants are observed in their existing circumstances.
Think of an observational study like being a wildlife photographer: you watch animals in their natural habitat without interfering, simply recording what you see.
Observational studies are useful when:
- It would be unethical to assign treatments (for example, you cannot randomly assign people to smoke cigarettes to study lung cancer risk).
- The research question involves naturally occurring groups or behaviors.
- Experiments are impractical or too expensive.
However, observational studies have a critical limitation: they can reveal associations or correlations between variables, but they cannot establish causation. Just because two variables are related does not mean one causes the other. There may be confounding variables-hidden factors that influence both variables being studied.
Example: A researcher notices that students who eat breakfast regularly tend to have higher test scores than students who skip breakfast.
Can the researcher conclude that eating breakfast causes higher test scores?
Solution:
This is an observational study because the researcher simply observed existing patterns without assigning students to eat or skip breakfast.
While there is an association between eating breakfast and test scores, we cannot conclude causation. Possible confounding variables include family income (wealthier families may provide breakfast and also afford tutoring), overall health habits, time management skills, or parental involvement.
The researcher can only conclude that breakfast eating and test scores are associated, not that one causes the other.
Experiments
An experiment is a study in which researchers actively impose a treatment or condition on participants and then observe the outcomes. The key feature of an experiment is that the researcher controls and manipulates at least one variable, called the explanatory variable or independent variable, to observe its effect on another variable, called the response variable or dependent variable.
Experiments are the gold standard for establishing causation because the researcher controls the assignment of treatments, which helps eliminate confounding variables.
Key components of a well-designed experiment include:
- Random assignment: Participants are randomly assigned to treatment groups to ensure groups are comparable at the start.
- Control group: A group that does not receive the treatment, used as a baseline for comparison.
- Replication: The experiment includes enough participants to detect real effects and reduce the impact of random variation.
Example: Researchers want to test whether a new app improves student performance in algebra.
They randomly assign 200 students to two groups: 100 use the app for 30 minutes daily, and 100 study using traditional methods for the same amount of time.
After six weeks, both groups take the same algebra test.Why is this an experiment, and what can researchers conclude?
Solution:
This is an experiment because researchers actively assigned the treatment (using the app vs. traditional study methods) to participants.
The explanatory variable is the study method (app vs. traditional), and the response variable is the algebra test score.
Because students were randomly assigned, any differences in test scores can be attributed to the study method rather than pre-existing differences between students.
If the app group scores significantly higher, researchers can conclude that the app causes improved performance.
Types of Observational Studies
Within the category of observational studies, there are several distinct types, each with specific uses and characteristics.
Sample Surveys
A sample survey collects data from a subset of a population to learn about the entire population. Surveys ask participants questions about their behaviors, opinions, characteristics, or experiences. The quality of a survey depends heavily on how the sample is selected.
Random sampling is crucial: every member of the population should have an equal chance of being selected. This helps ensure the sample is representative of the population, meaning it accurately reflects the population's characteristics.
Common survey methods include:
- Simple random sampling: Every individual has an equal probability of selection.
- Stratified sampling: The population is divided into subgroups (strata) based on a characteristic, and random samples are taken from each stratum.
- Cluster sampling: The population is divided into clusters (often geographic), some clusters are randomly selected, and all individuals within selected clusters are surveyed.
Surveys can suffer from various types of bias:
- Selection bias: The method of choosing participants systematically excludes certain groups.
- Response bias: The way questions are worded influences answers.
- Nonresponse bias: People who choose not to respond differ systematically from those who do respond.
Example: A school wants to know what percentage of its 1,200 students support extending the lunch period by 10 minutes.
Administrators randomly select 120 students and ask them their opinion.
Of these, 78 students support the extension.What can the school conclude?
Solution:
This is a sample survey using simple random sampling.
The sample proportion supporting the extension is 78 ÷ 120 = 0.65 or 65%.
Because the sample was randomly selected, the school can estimate that approximately 65% of all students support extending the lunch period.
The school should recognize this is an estimate with some uncertainty; the true population proportion is likely close to but not exactly 65%.
Retrospective and Prospective Studies
A retrospective study (also called a case-control study) looks backward in time. Researchers identify individuals with a particular outcome (cases) and individuals without that outcome (controls), then look back to compare their past exposures or characteristics.
Retrospective studies are like detective work: you start with the crime (the outcome) and investigate backward to find clues (potential causes).
A prospective study (also called a cohort study) follows individuals forward in time. Researchers identify groups based on exposure to a potential risk factor, then follow them over time to see who develops the outcome of interest.
Prospective studies are like following students from kindergarten through high school, tracking who develops certain academic outcomes based on their early reading habits.
Prospective studies are generally more reliable than retrospective studies because they avoid recall bias (the problem that people may not accurately remember past behaviors or exposures). However, prospective studies take longer and cost more.
Example: Researchers want to study the relationship between physical activity in adolescence and heart health in adulthood.
Design A: Identify 500 adults with heart disease and 500 without, then ask them about their teenage exercise habits.
Design B: Identify 1,000 teenagers, measure their physical activity levels, and follow them for 30 years to see who develops heart disease.Which design is retrospective and which is prospective?
Solution:
Design A is retrospective because it starts with the outcome (heart disease status) and looks backward at past exercise habits.
Design B is prospective because it starts with the exposure (teenage exercise levels) and follows participants forward to observe outcomes.
Design B is stronger because participants' exercise levels are measured directly rather than relying on memory 30 years later, but it requires much more time and resources.
Elements of Experimental Design
Well-designed experiments incorporate several key principles to ensure valid and reliable results.
Control and Comparison
A control group serves as a baseline for comparison. This group receives no treatment, a placebo, or a standard treatment, allowing researchers to measure what would happen without the experimental treatment.
A placebo is an inactive treatment that appears identical to the actual treatment. The placebo effect occurs when participants improve simply because they believe they are receiving treatment, not because of the treatment itself.
Control groups help researchers isolate the effect of the treatment from other factors like the placebo effect, natural improvement over time, or the attention participants receive in a study.
Randomization
Randomization is the process of using chance to assign participants to treatment groups. Random assignment ensures that treatment groups are similar in all respects except for the treatment itself, including both measured and unmeasured variables.
Randomization helps eliminate confounding variables-variables related to both the treatment and the outcome that could create a false appearance of causation.
Without randomization, groups might differ in systematic ways. For example, if researchers let participants choose their treatment, those who choose treatment A might be more motivated or healthier than those who choose treatment B, making fair comparison impossible.
Blinding
Blinding means keeping certain people unaware of who receives which treatment. Blinding reduces bias in how treatments are administered and how outcomes are measured.
- Single-blind: Participants do not know which treatment they receive, but researchers do know.
- Double-blind: Neither participants nor the researchers administering treatments and measuring outcomes know who receives which treatment.
Double-blind experiments are the strongest design because they prevent both participant bias (placebo effects) and experimenter bias (unconsciously treating groups differently or measuring outcomes differently based on expectations).
Example: Pharmaceutical researchers test a new pain medication.
They recruit 300 participants with chronic back pain and randomly assign 150 to receive the medication and 150 to receive an identical-looking sugar pill.
Neither participants nor the doctors measuring pain levels know who receives which pill.Identify the control group and the type of blinding used.
Solution:
The control group is the 150 participants receiving the sugar pill (placebo).
This is a double-blind experiment because neither participants nor the doctors measuring outcomes know who receives the actual medication.
This design controls for the placebo effect (participants might feel better just from receiving any pill) and prevents doctors from unconsciously rating pain differently based on which treatment they think a participant received.
Replication
Replication has two important meanings in experimental design:
- Adequate sample size: Including enough participants (experimental units) so that real treatment effects can be distinguished from random variation. Larger samples reduce the impact of chance and increase confidence in results.
- Repeating the experiment: Conducting the same experiment multiple times, ideally by different researchers in different settings, to verify that results are consistent and not due to unique circumstances of one study.
Without adequate replication, small differences due to chance might be mistaken for real treatment effects, or real effects might be missed entirely.
Blocking in Experimental Design
Sometimes researchers know that certain participant characteristics strongly influence the response variable. Blocking is a technique that groups participants into blocks based on these characteristics before randomly assigning treatments within each block.
Think of blocking like separating basketball players by height before testing different training programs: you create groups of tall players and short players, then randomly assign training programs within each height group. This ensures both training programs are tested on similar mixes of tall and short players.
Common blocking variables include age, gender, initial disease severity, or geographic location. Blocking reduces variability and makes comparisons more precise.
Example: Researchers test two teaching methods for calculus.
They have 200 students: 100 with strong algebra backgrounds and 100 with weak algebra backgrounds.
They suspect algebra background strongly affects calculus performance.How should they use blocking?
Solution:
Create two blocks: one block of 100 students with strong algebra backgrounds, and one block of 100 students with weak algebra backgrounds.
Within the strong algebra block, randomly assign 50 students to teaching method 1 and 50 to teaching method 2.
Within the weak algebra block, randomly assign 50 students to teaching method 1 and 50 to teaching method 2.
This ensures both teaching methods are tested on equal numbers of students with strong and weak algebra backgrounds, eliminating algebra background as a confounding variable and allowing for a more precise comparison of the teaching methods.
Scope of Inference
After collecting data, researchers must consider two critical questions about what conclusions they can draw: To whom do the results apply? Can we establish causation?
The scope of inference depends on two factors:
- How participants were selected: Random selection from a population allows generalization to that population.
- How treatments were assigned: Random assignment of treatments allows causal conclusions.
This creates four possible scenarios:
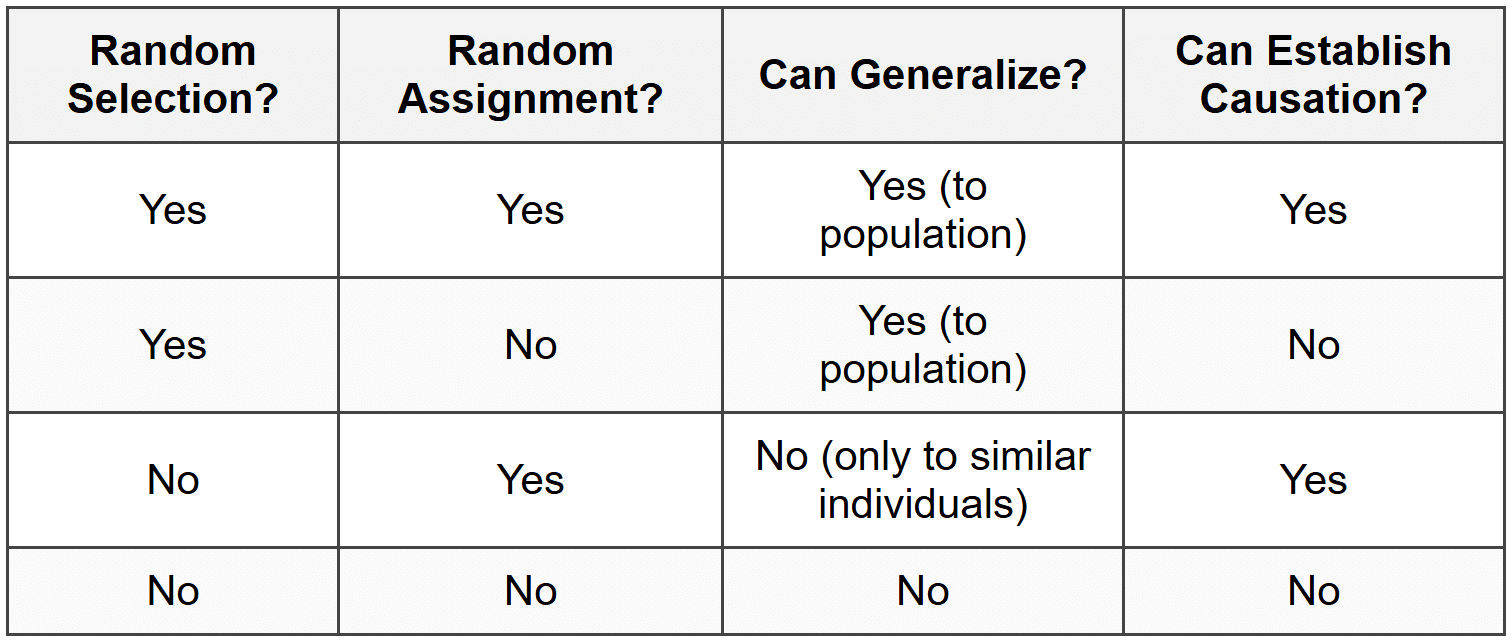
Generalization means the results apply beyond just the participants studied. If participants were randomly selected from a population, results can be generalized to that entire population. If participants were volunteers or a convenience sample, results apply only to people similar to those studied.
Causation means we can conclude that changes in the explanatory variable caused changes in the response variable. Only experiments with random assignment can establish causation.
Example: Study 1: Researchers randomly select 500 high school students from all students in a state and randomly assign 250 to use a math tutoring app and 250 to a control group.
Study 2: Researchers recruit 500 volunteer high school students and randomly assign 250 to the tutoring app and 250 to the control group.
Study 3: Researchers survey 500 randomly selected students about whether they currently use tutoring apps and compare math grades between users and non-users.What can each study conclude?
Solution:
Study 1 has both random selection and random assignment. Results can be generalized to all high school students in the state, and causation can be established. If the app group performs better, the app causes improvement for students in this state.
Study 2 has random assignment but no random selection (volunteers only). Causation can be established, but results apply only to students similar to the volunteers, not all students. If the app group performs better, the app causes improvement, but only for students like these volunteers.
Study 3 has random selection but no random assignment (observational study). Results can be generalized to the state's students, but causation cannot be established. If app users have higher grades, we can only say app use and grades are associated among the state's students, not that the app causes higher grades.
Common Sources of Bias
Bias in study design can lead to systematic errors that distort results. Recognizing sources of bias is essential for evaluating the quality of any study.
Selection Bias
Selection bias occurs when the method of selecting participants systematically excludes or underrepresents certain groups, resulting in a sample that does not represent the population of interest.
Examples include:
- Voluntary response bias: Only people with strong opinions choose to participate (like online polls where angry people are more likely to respond).
- Convenience sampling: Choosing participants because they are easy to reach (like surveying only students in one class to represent a whole school).
- Undercoverage: Some groups have no chance or reduced chance of being selected (like a phone survey that excludes people without phones).
Measurement Bias
Measurement bias occurs when the method of collecting data systematically distorts the true values.
Sources include:
- Response bias: Question wording, order, or interviewer behavior influences answers. Leading questions push respondents toward particular answers.
- Social desirability bias: Respondents give answers they think are socially acceptable rather than truthful (like underreporting unhealthy behaviors).
- Recall bias: Participants inaccurately remember past events or behaviors.
Confounding
A confounding variable is related to both the explanatory variable and the response variable, making it impossible to determine which variable is actually influencing the response. Confounding is the primary reason observational studies cannot establish causation.
Imagine observing that people who carry umbrellas get wet more often. The confounding variable is rainy weather: rain causes both umbrella carrying and getting wet. Umbrellas don't cause wetness; the confounding variable (rain) influences both.
Randomization in experiments helps prevent confounding by distributing confounding variables equally across treatment groups.
Ethical Considerations
All research involving human participants must follow ethical principles to protect participants from harm.
Key ethical requirements include:
- Informed consent: Participants must understand the study's purpose, procedures, risks, and benefits before agreeing to participate. They must participate voluntarily and be free to withdraw at any time.
- Minimizing harm: Researchers must minimize physical, psychological, and social risks to participants. Potential benefits should outweigh risks.
- Confidentiality: Personal information must be protected and kept private.
- Special protections: Vulnerable populations like children, prisoners, or individuals with diminished decision-making capacity require additional safeguards.
These ethical principles explain why some experiments cannot be conducted. For example, we cannot randomly assign people to smoke cigarettes to study cancer risk, so we rely on observational studies despite their limitations.
Institutional Review Boards (IRBs) review research proposals to ensure ethical standards are met before studies begin.
Interpreting Study Results Responsibly
When evaluating study results reported in news articles or research papers, consider these questions:
- Was this an observational study or an experiment?
- If observational, beware of causal language like "causes" or "prevents"-only association can be claimed.
- If an experiment, was there random assignment to treatments?
- Was there a control group for comparison?
- How were participants selected? Can results be generalized?
- What potential sources of bias exist?
- Was the sample size adequate?
- Are there plausible confounding variables?
- Do the researchers' conclusions match what the study design allows?
Strong statistical thinking requires matching the strength of conclusions to the strength of the study design. A well-designed randomized experiment provides strong evidence for causation. An observational study with a convenience sample provides much weaker evidence and cannot support causal claims.
Understanding study design empowers you to critically evaluate research claims, recognize limitations, and make informed decisions based on statistical evidence. Whether reading about a new medical treatment, educational intervention, or social policy, asking questions about how data were collected helps you distinguish between reliable findings and weak or misleading claims.


