Chapter Notes: Probability Using Sample Spaces


When we want to know how likely something is to happen, we use probability. Probability is a number that tells us the chance that an event will occur. To find probabilities accurately, we organize all the possible results into something called a sample space. A sample space is the complete list of all possible outcomes of an experiment or situation. Understanding how to create and use sample spaces is fundamental to calculating probabilities correctly and making informed predictions about uncertain events.
Understanding Outcomes and Events
Before we work with sample spaces, we need to understand a few key terms. An outcome is a single possible result of an experiment or activity. An event is one or more outcomes that we are interested in. For example, if you flip a coin, "heads" is one outcome and "tails" is another outcome. If we want to know the probability of getting heads, then "getting heads" is the event we care about.
Think of outcomes like individual books on a shelf, and an event as a category of books you want to find, such as "mystery novels."
The word experiment in probability doesn't mean a science lab experiment. It means any activity or process that produces a result we can observe. Rolling a die, spinning a spinner, drawing a card, or choosing a marble from a bag are all examples of probability experiments.
What Is a Sample Space?
A sample space is the set of all possible outcomes for a particular experiment. We usually list the sample space inside curly braces { } and use capital letter S to represent it. Each outcome in the sample space should be:
- Distinct: Each outcome is different from the others
- Complete: All possible outcomes are included
- Mutually exclusive: Only one outcome can happen at a time
Example: A coin is flipped once.
What is the sample space?
Solution:
When we flip a coin, there are exactly two possible outcomes: the coin lands showing heads, or it lands showing tails.
We write the sample space as: S = {Heads, Tails} or S = {H, T}
The sample space contains 2 outcomes.
Example: A standard six-sided die is rolled once.
What is the sample space?
Solution:
A standard die has six faces numbered 1 through 6. When rolled, it will land showing one of these numbers.
The sample space is: S = {1, 2, 3, 4, 5, 6}
The sample space contains 6 outcomes.
Writing Sample Spaces for Different Experiments
Different experiments require different ways of organizing the sample space. Sometimes we can list outcomes simply; other times we need more structure.
Simple Lists
For experiments with a small number of outcomes, we can list them directly.
Example: A spinner is divided into four equal sections colored red, blue, green, and yellow.
The spinner is spun once.What is the sample space?
Solution:
The spinner can land on any one of the four colors.
Sample space: S = {Red, Blue, Green, Yellow}
The sample space has 4 possible outcomes.
Organized Lists for Two-Stage Experiments
When an experiment happens in two stages, such as flipping two coins or rolling a die twice, the sample space grows larger. Each outcome needs to show what happened in both stages.
Example: Two coins are flipped, one after the other.
The first coin is a penny and the second is a nickel.List the complete sample space.
Solution:
For the first coin (penny), we can get H or T.
For the second coin (nickel), we can get H or T.
We write each outcome as an ordered pair: (first coin, second coin)
Possible outcomes:
(H, H) - both coins show heads
(H, T) - penny shows heads, nickel shows tails
(T, H) - penny shows tails, nickel shows heads
(T, T) - both coins show tailsSample space: S = {(H,H), (H,T), (T,H), (T,T)}
The sample space contains 4 outcomes.
Tree Diagrams
A tree diagram is a visual tool that helps us find all possible outcomes systematically. It looks like a tree with branches, where each branch represents a possible outcome at each stage of the experiment.
To create a tree diagram:
- Start with a single point on the left side
- Draw branches for each possible outcome of the first stage
- From the end of each branch, draw new branches for each possible outcome of the second stage
- Continue for all stages
- Read each complete path from left to right to identify one outcome
Example: A coin is flipped and then a four-sided die (numbered 1, 2, 3, 4) is rolled.
Use a tree diagram to find the sample space and count the total number of outcomes.
Solution:
First stage (coin flip): H or T - this gives us 2 branches
Second stage (die roll): 1, 2, 3, or 4 - from each coin outcome, we draw 4 branches
The tree diagram shows these paths:
H → 1: (H,1)
H → 2: (H,2)
H → 3: (H,3)
H → 4: (H,4)
T → 1: (T,1)
T → 2: (T,2)
T → 3: (T,3)
T → 4: (T,4)Sample space: S = {(H,1), (H,2), (H,3), (H,4), (T,1), (T,2), (T,3), (T,4)}
The sample space has 8 outcomes.
Tables for Two-Stage Experiments
When both stages have several outcomes, a table (also called a two-way table or grid) can be easier to read than a tree diagram or list. We put the outcomes of the first stage along the top and the outcomes of the second stage down the left side. Each cell in the table represents one outcome.
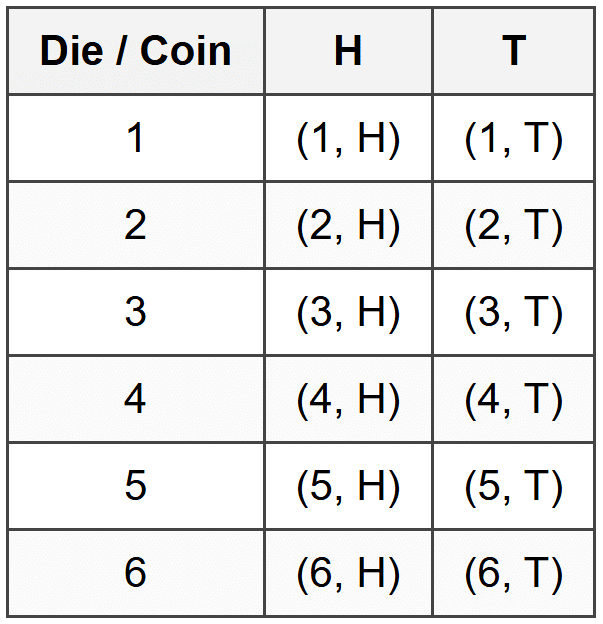
Example: One die is rolled and one coin is flipped.
Organize the sample space in a table.
Solution:
The die has outcomes {1, 2, 3, 4, 5, 6} and the coin has outcomes {H, T}.
The sample space has 12 outcomes.
Calculating the Size of a Sample Space
Sometimes we don't need to list every outcome; we just need to know how many there are. The Fundamental Counting Principle helps us find the total number of outcomes quickly.
Fundamental Counting Principle: If one event can occur in m ways and a second independent event can occur in n ways, then the two events together can occur in \( m \times n \) ways.
This principle extends to more than two stages: multiply the number of outcomes at each stage.
Example: A restaurant offers a lunch special where you choose one sandwich from 5 types, one side from 3 options, and one drink from 4 options.
How many different lunch combinations are possible?
Solution:
Number of sandwich choices = 5
Number of side choices = 3
Number of drink choices = 4
Total combinations = 5 × 3 × 4 = 60
There are 60 different lunch combinations possible.
Finding Probability Using Sample Spaces
Once we have the sample space, we can calculate probabilities. The probability of an event is the ratio of favorable outcomes to total possible outcomes.
\[ P(\text{event}) = \frac{\text{Number of favorable outcomes}}{\text{Total number of outcomes in sample space}} \]Where \( P(\text{event}) \) represents the probability of the event occurring. This formula assumes all outcomes in the sample space are equally likely, meaning each outcome has the same chance of happening.
Basic Probability Calculations
Example: A fair six-sided die is rolled once.
What is the probability of rolling a number greater than 4?
Solution:
Sample space: S = {1, 2, 3, 4, 5, 6}, which has 6 outcomes
Event: rolling a number greater than 4
Favorable outcomes: {5, 6}, which has 2 outcomes
Probability = \( \frac{2}{6} = \frac{1}{3} \)
The probability of rolling a number greater than 4 is \( \frac{1}{3} \) or approximately 0.333.
Example: Two coins are flipped.
Recall that the sample space is S = {(H,H), (H,T), (T,H), (T,T)}.What is the probability of getting exactly one head?
Solution:
Total outcomes in sample space = 4
Event: exactly one head appears
Favorable outcomes: (H,T) and (T,H), which gives us 2 outcomes
Probability = \( \frac{2}{4} = \frac{1}{2} \)
The probability of getting exactly one head is \( \frac{1}{2} \) or 0.5.
Probabilities with Multiple Conditions
Sometimes we need to find the probability of an event that satisfies more than one condition. The key is to carefully identify which outcomes in the sample space meet all the conditions.
Example: A die is rolled and a coin is flipped.
From an earlier example, we know there are 12 outcomes in the sample space.What is the probability that the die shows an even number AND the coin shows heads?
Solution:
Total outcomes = 12
Event: die shows even number (2, 4, or 6) AND coin shows H
Favorable outcomes: (2,H), (4,H), (6,H), which is 3 outcomes
Probability = \( \frac{3}{12} = \frac{1}{4} \)
The probability is \( \frac{1}{4} \) or 0.25.
Special Types of Events
Certain and Impossible Events
A certain event is one that always happens. Its probability is 1, because all outcomes in the sample space are favorable. An impossible event is one that can never happen. Its probability is 0, because no outcomes are favorable.
Example: A standard die numbered 1 through 6 is rolled.
What is the probability of rolling a number less than 10?
Solution:
Sample space: {1, 2, 3, 4, 5, 6}, which has 6 outcomes
Event: rolling a number less than 10
All outcomes (1, 2, 3, 4, 5, 6) are less than 10, so favorable outcomes = 6
Probability = \( \frac{6}{6} = 1 \)
The probability is 1, meaning this event is certain to happen.
Example: A standard die is rolled.
What is the probability of rolling a 7?
Solution:
Sample space: {1, 2, 3, 4, 5, 6}, which has 6 outcomes
Event: rolling a 7
A standard die does not have a 7, so favorable outcomes = 0
Probability = \( \frac{0}{6} = 0 \)
The probability is 0, meaning this event is impossible.
Complementary Events
The complement of an event includes all outcomes in the sample space that are NOT in the original event. If event A has probability \( P(A) \), then its complement (written as \( A' \) or "not A") has probability:
\[ P(A') = 1 - P(A) \]This relationship is useful because sometimes it's easier to calculate the probability that something does NOT happen, then subtract from 1.
Example: A die is rolled.
What is the probability of NOT rolling a 3?
Solution:
Sample space: {1, 2, 3, 4, 5, 6}, which has 6 outcomes
Probability of rolling a 3: \( P(\text{rolling 3}) = \frac{1}{6} \)
Probability of NOT rolling a 3: \( P(\text{not 3}) = 1 - \frac{1}{6} = \frac{5}{6} \)
We can verify: favorable outcomes are {1, 2, 4, 5, 6}, which is 5 outcomes, giving \( \frac{5}{6} \)
The probability of not rolling a 3 is \( \frac{5}{6} \).
Sample Spaces with Replacement vs. Without Replacement
When selecting items from a group, whether we put items back after selecting them changes the sample space.
With replacement means that after selecting an item, we put it back before the next selection. The same item can be chosen more than once.
Without replacement means that once an item is selected, it stays out. It cannot be chosen again.
Example: A bag contains three marbles: one red (R), one blue (B), and one green (G).
Two marbles are drawn one at a time WITH replacement.List the sample space and find the probability that both marbles are the same color.
Solution:
First draw: R, B, or G
Second draw (with replacement): R, B, or G
Sample space using a systematic list:
(R,R), (R,B), (R,G)
(B,R), (B,B), (B,G)
(G,R), (G,B), (G,G)Total outcomes = 9
Event: both marbles the same color
Favorable outcomes: (R,R), (B,B), (G,G), which is 3 outcomes
Probability = \( \frac{3}{9} = \frac{1}{3} \)
The probability that both marbles are the same color is \( \frac{1}{3} \).
Example: A bag contains three marbles: one red (R), one blue (B), and one green (G).
Two marbles are drawn one at a time WITHOUT replacement.List the sample space and find the probability that both marbles are the same color.
Solution:
First draw: R, B, or G
Second draw (without replacement): only 2 marbles remain
Sample space:
If first is R: (R,B), (R,G)
If first is B: (B,R), (B,G)
If first is G: (G,R), (G,B)Total outcomes = 6
Note: outcomes like (R,R), (B,B), (G,G) are impossible because we don't replace the marble
Event: both marbles the same color
Favorable outcomes = 0 (impossible)
Probability = \( \frac{0}{6} = 0 \)
The probability that both marbles are the same color is 0.
Using Sample Spaces to Compare Probabilities
Sample spaces let us compare how likely different events are by examining their probabilities side by side.
Example: Two dice are rolled, and their sum is calculated.
The sample space has 36 outcomes (6 outcomes for first die × 6 for second die).Which is more likely: rolling a sum of 7 or rolling a sum of 10?
Solution:
Total outcomes = 36
Event 1: sum equals 7
Favorable outcomes: (1,6), (2,5), (3,4), (4,3), (5,2), (6,1), which is 6 outcomes
Probability of sum 7: \( P(7) = \frac{6}{36} = \frac{1}{6} \)
Event 2: sum equals 10
Favorable outcomes: (4,6), (5,5), (6,4), which is 3 outcomes
Probability of sum 10: \( P(10) = \frac{3}{36} = \frac{1}{12} \)
Since \( \frac{1}{6} > \frac{1}{12} \), rolling a sum of 7 is more likely than rolling a sum of 10.
Key Properties of Probability
All probabilities follow these important rules:
- Probability values are always between 0 and 1, inclusive: \( 0 \leq P(\text{event}) \leq 1 \)
- The sum of probabilities of all outcomes in a sample space equals 1
- If two events cannot happen at the same time (mutually exclusive), the probability that one OR the other happens is the sum of their individual probabilities
Understanding sample spaces gives you the foundation to calculate accurate probabilities, make predictions, and understand chance in everyday situations from weather forecasts to games to scientific experiments.


