Chapter Notes: Describing Motion Around Us


Introduction
Everything in nature is in motion - from massive astronomical objects to subatomic particles. There is a wide variety of motion in nature such as flitting butterflies, slithering snakes, hopping hares, galloping horses, dancing dust particles in a sunbeam, smoke particles moving in air, rising and falling of ocean tides, and gathering clouds.
To study complex motions, scientists first study them in idealised simplified forms. Such types of motion are linear, circular and oscillatory. In this chapter, we learn more about linear motion (motion in a straight line) and uniform circular motion. We also learn new physical quantities - displacement, average velocity and average acceleration.
4.1 Motion in a Straight Line
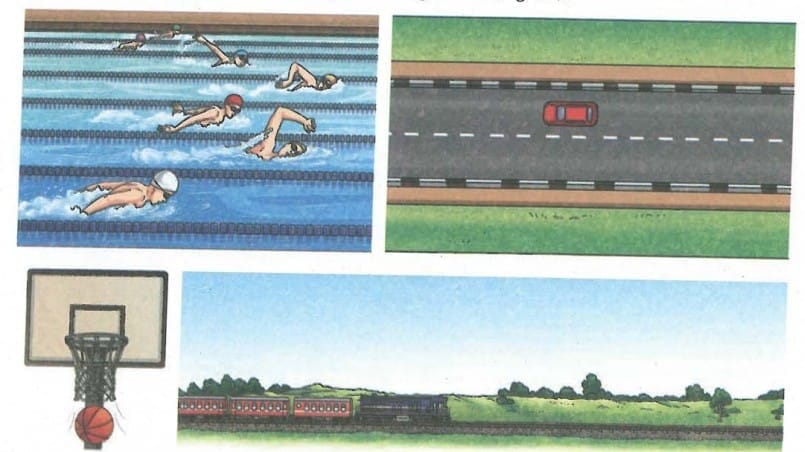
When an object moves in a straight line, its motion is called linear motion or motion in a straight line. It is the simplest kind of motion. Examples: children in a swimming race, a vertically falling ball, a car moving along a straight highway, a train on a straight track.
4.1.1 Describing Position
To describe the position of an object, we first need to specify a fixed point as the reference point (Origin 'O'). The distance and direction of the object with respect to the reference point, at any instant of time, describes the position of the object at that instant.
- If the position of the object with respect to the reference point changes with time, the object is said to be in motion.
- If the position does not change with time, the object is said to be at rest.
For an object moving in a straight line, it can move only in one of two directions - forward or backward. The direction is represented by plus (+) and minus (-) signs. Positions to the right of the reference point O are generally taken as positive and to the left as negative.
Important Note:
- An instant of time is a single reading of a clock at a given point of time.
- A time interval is the time duration between two instants of time, i.e., between two readings of a clock.
4.1.2 Distance Travelled and Displacement
1. Distance
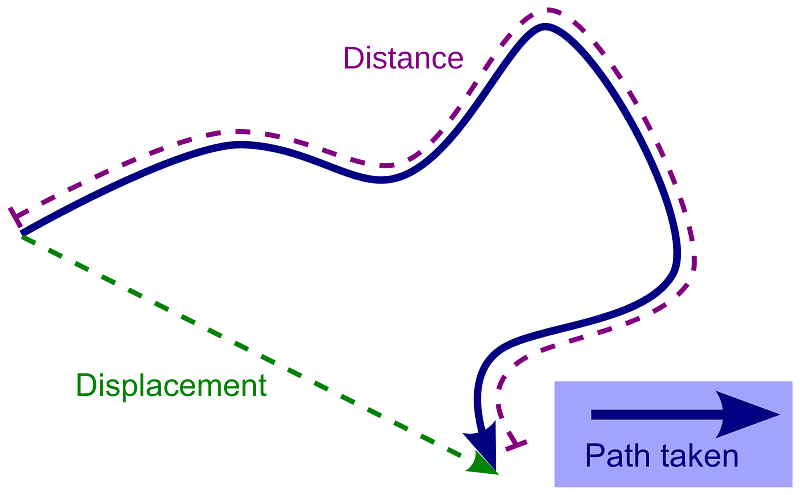
The actual path of length travelled by an object during its journey from its initial position to its final position is called the distance.
- Distance is a scalar quantity that requires only magnitude but no direction to explain it.
- Example: Ramesh travelled 65 km. (Distance is measured by odometer in vehicles.)
2. Displacement
The shortest distance travelled by an object during its journey from its initial position to its final position is called displacement.
- Displacement is a vector quantity requiring both magnitude and direction for its explanation.
- Example: Ramesh travelled 65 km southwest from Clock Tower.
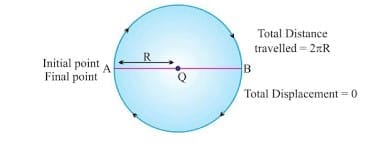
- Displacement can be zero (when the initial point and final point of motion are the same)
Example: Circular motion.
 Example of Zero Displacement
Key difference between distance and displacement:
| Distance | Displacement |
|---|---|
| Total path length covered | Net change in position (shortest path from start to end) |
| Always positive | Can be positive, negative or zero |
| Only magnitude (scalar) | Both magnitude and direction (vector) |
| Distance ≥ magnitude of displacement | Magnitude of displacement ≤ distance |
Physical quantities which can be specified by just their numerical value are called scalars.
Physical quantities which require specifying both the direction and magnitude are called vectors.
Note: For motion in a straight line, the total distance travelled and the magnitude of displacement are equal only if the object moves without turning back, i.e., it moves in one direction only.
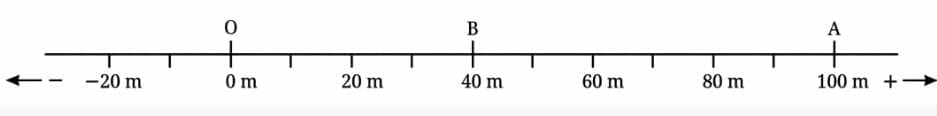
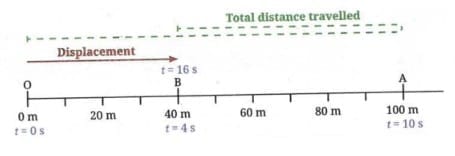
Example (from chapter): An athlete starts running from O at t = 0 s, reaches point B at t = 4 s (OB = 40 m), then reaches A at t = 10 s (OA = 100 m), then runs back to B at t = 16 s.
- Total distance travelled = OA + AB = 100 m + 60 m = 160 m
- Displacement (net change in position from start to stop) = OB = 40 m in the positive direction
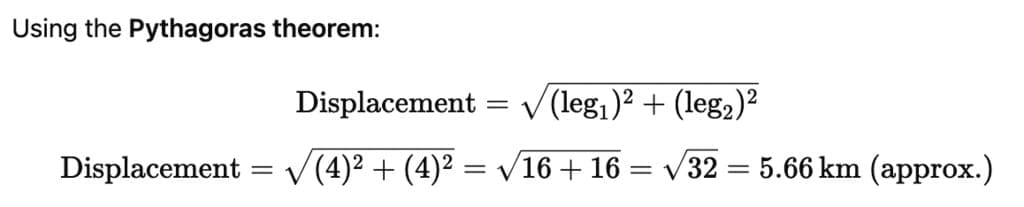
Example : A body travels 4 km towards North then he turns to his right and travels another 4 km before coming to rest. Calculate
(i) total distance travelled,
(ii) total displacement.
Sol.
The total distance is the sum of all the paths travelled:
Total Distance = 4km (North) + 4km (Right) = 8km
Since displacement is the shortest straight-line distance between the starting point and the final point.
The path forms a right triangle, where:
- One leg = 4 km (North direction),
- Other leg = 4 km (Right direction).
4.1.3 Uniform and Non - Uniform Motion
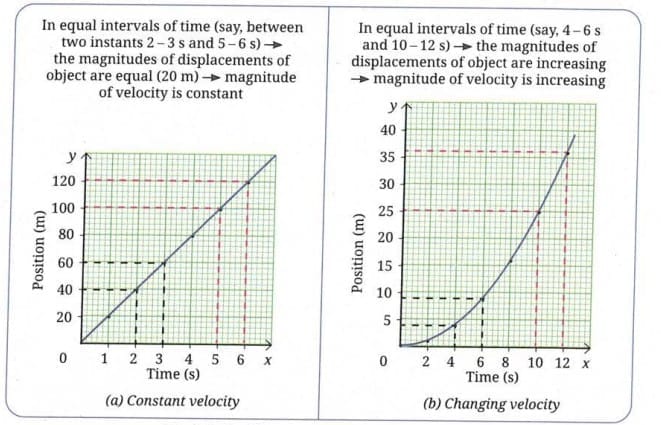
Uniform motion: If an object moving in a straight line travels equal distances in equal intervals of time (for all possible choices of time intervals), it is said to be in uniform motion in a straight line. The object moves at a constant speed.
Non-uniform motion: If the object travels unequal distances in equal intervals of time, it is in non-uniform motion. The object's speed is increasing, decreasing, or a combination of both.
4.1.4 Average Speed and Average Velocity
Average Speed: Average speed tells us how fast or slow an object moves.
It is defined as: average speed = total distance travelled / time interval
Since distance has no direction, average speed also has no direction - it only has a numerical value.
Example : A car travels 20 km in first hour, 40 km in second hour and 30 km in third hour. Calculate the average speed of the vehicle.
Sol: Speed in 1st hour = 20 km/hr
Distance travelled during 1st hr = 1 × 20= 20 km
Speed in 2nd hour = 40 km/hr
Distance travelled during 2nd hr = 1 × 40= 40 km
Speed in 3rd hour = 30 km/hr
Distance travelled during 3rd hr = 1 × 30= 30 km
Average speed = Total distance travelled/Total time taken
= (20 + 40 + 30)/3 = 90/3 = 30 km/hr
Average Velocity: Average velocity describes how fast the position of an object is changing and in which direction.
average velocity = change in position / time interval = displacement / time interval
Using symbols: vav = s / t
where vav = average velocity, s = displacement, t = time interval.
- To express average velocity, you need to specify its magnitude as well as direction.
- The direction of velocity is the same as the direction of displacement - indicated by '+' or '-' sign.
- SI unit of average speed and average velocity is the same: metre per second (m s⁻¹ or m/s). Also commonly measured in km h⁻¹.
Important Notes:
- For motion in a straight line in one direction, average speed and the magnitude of average velocity are equal.
- The reading of the speedometer of a vehicle is nearly (but not exactly) the same as the magnitude of the velocity at an instant while the direction of tyres gives the direction of velocity at that instant.
- What we simply called 'velocity at an instant' is known as 'instantaneous velocity'. As the time interval around an instant is made progressively smaller, the change in average velocity gets smaller and smaller. When the time interval becomes infinitesimally small, the average value of velocity approaches a fixed value called the Next instantaneous velocity.
Key concept - Rate of Change:The ratio of change in one quantity to the corresponding change in time is called the rate of change. Average velocity is the average rate of change of position with respect to time.
Example (from chapter): Sarang swims from one end to the other and back in a 25 m pool in 50 seconds.
Swimming Pool
- Total distance = 50 m, Displacement = 0 m
- Average speed = 50 m / 50 s = 1 m s⁻¹
- Average velocity = 0 m / 50 s = 0 m s⁻¹
This shows average speed and average velocity can be very different.
4.1.5 Average Acceleration
When a vehicle suddenly moves from rest or suddenly stops, you feel a jolt. This is due to the change in velocity. The physical quantity that describes how quickly velocity is changing is called average acceleration.
The average acceleration of an object over a time interval is the change in its velocity divided by the time interval.
average acceleration = change in velocity / time interval
average acceleration = (final velocity - initial velocity) / time interval
If initial velocity is u at time t₁ and final velocity is v at time t₂, then:
a = (v - u) / (t₂ - t₁)
- SI unit of average acceleration is m s⁻² or m/s².
- Like displacement and velocity, we need to specify both magnitude and direction of acceleration.
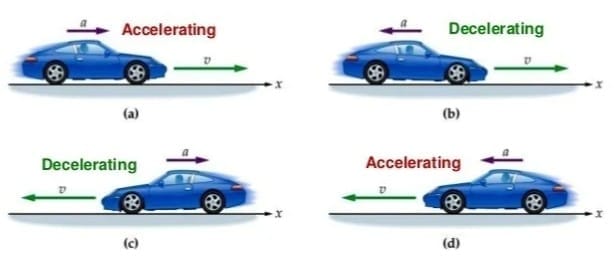
- If the magnitude of velocity is increasing, average acceleration is in the direction of velocity.
- If the magnitude of velocity is decreasing, average acceleration is opposite to the direction of velocity (this is sometimes called deceleration).
Average acceleration can result from:
- Change in magnitude of velocity
- Change in direction of velocity
- Change in both magnitude and direction
Constant acceleration: For an object moving in a straight line in the same direction, if the magnitude of velocity increases or decreases by equal amounts in equal intervals of time, the acceleration is constant.
Important Note: An object can be moving very fast yet have zero acceleration (e.g., a bus moving at constant velocity on a highway). Acceleration depends not on how fast an object is moving, but on how quickly its velocity is changing.
Example: A car speed increases from 40 km/hr to 60 km/hr in 5 sec. Calculate the acceleration of car.
Sol. u = 40km/hr = (40×5)/18 = 100/9 = 11.11 m/s
v = 60 km/hr = (60×5)/18 = 150/9 = 16.66 m/s
t = 5 sec
a = (v-u)/t = (16.66 - 11.11)/5 = 5.55/5 = 1.11 ms-2
4.2 Graphical Representation of Motion
A graph is a useful way to represent motion visually. It shows how position, velocity and acceleration change with time. Graphs help in:
- Comparing motion of two objects
- Calculating physical quantities
- Identifying whether motion is uniform or non-uniform
Note: All the graphs discussed in this chapter are for motion in a straight line in one direction. In this case, distance = magnitude of displacement, and speed = magnitude of velocity. If position is zero at time zero, then the position-time graph is same as the distance-time graph.
4.2.1 Plotting a Graph
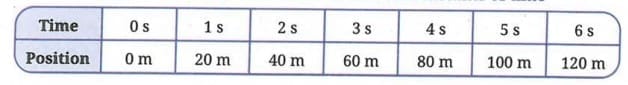
To plot a graph, let us use the data given in Table for a vehicle moving on a straight road.
Steps to plot a position-time graph:
1. Draw two perpendicular lines (x-axis for time, y-axis for position), meeting at origin O.
2. Choose a suitable scale for each axis.
3. Mark values on each axis as per the chosen scale.
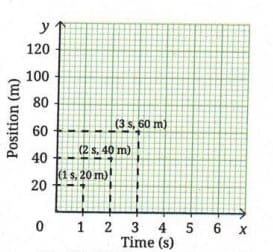
4. Plot each (time, position) point on the graph.
5. Join all points to get the graph - a straight line or curve.
Important Note: A graph is not a route map. It does not show the route but how the position of the object changes with time with respect to the origin.
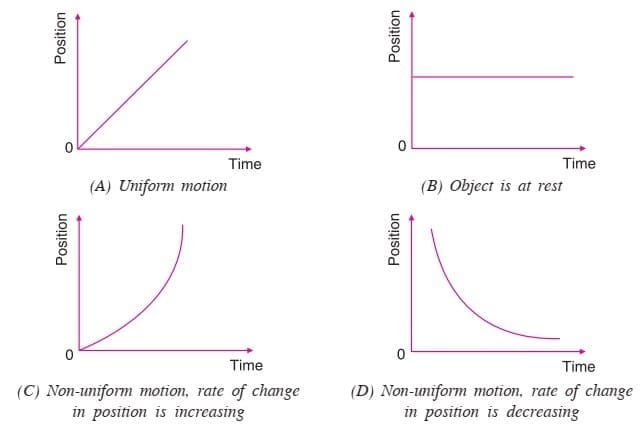
4.2.2 Position-Time Graphs
What does the shape of the position-time graph indicate?
| Shape of Graph | Meaning |
|---|---|
| Straight line (sloping upward) | Constant velocity (uniform motion) |
| Straight line parallel to time axis | Object is stationary (at rest) |
| Curved line | Changing velocity (accelerated motion) |
| Steeper slope | Higher velocity |
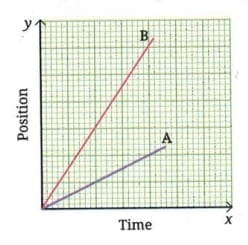
If two objects A and B are shown in the same position-time graph, the one with the steeper slope has the higher velocity. If the slope of A is steeper than B, velocity of A > velocity of B.
Trick used : Always think from which line there are higher chances to slip , that is steeper slope which has higher velocity.
Now usually above Trick answer the question from chapter
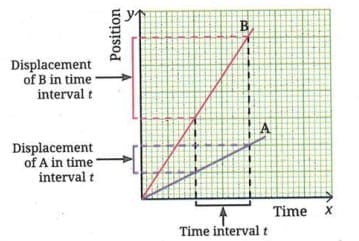
Question: The position-time graphs of two objects A and B are given in Fig. Which object of the magnitude of average velocity is higher?
Sol: By making lines parallel to axes , it is found that the displacement of object B is more than object A for the same time interval. That is, the slope of line for B is steeper than the slope for line A. Thus, the velocity of B is higher than that of A.
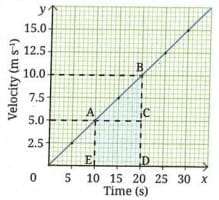
Calculating Velocity from Position Time Graph
The slope of the position-time graph gives the average velocity of the object.
The average velocity between two instants is calculated as:
v = (s₂ - s₁) / (t₂ - t₁) = BC / CA (slope of the line)
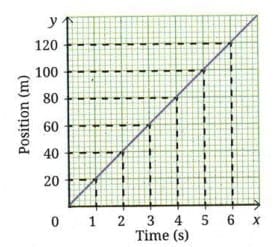
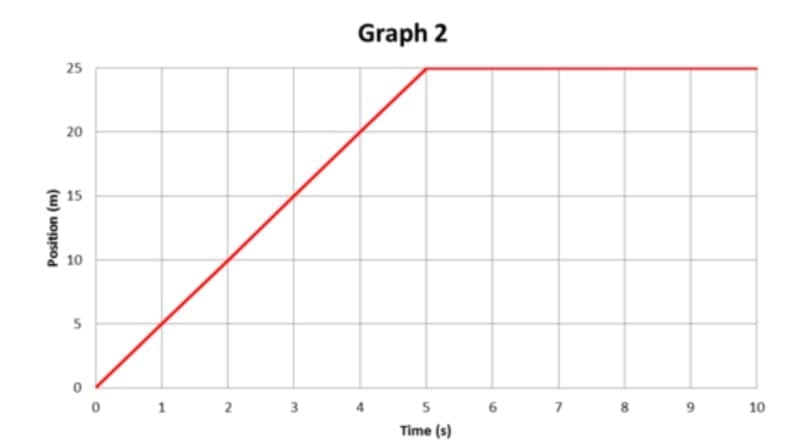
For Example : Let's see the graph given below
By extracting values of time t₁ and t₂ , and distances s₁ and s₂ from the graph, the magnitude of average velocity can be calculated as:
s₂ = 25 m/s s₁= 0 m/s t₂ = 5s t₁ = 0s
Vav = s₂ -s₁/t₂- t₁
= 25 - 0 / 5 - 0
= 25/ 5 = 5 m/s
Average Velocity = 5 m/s
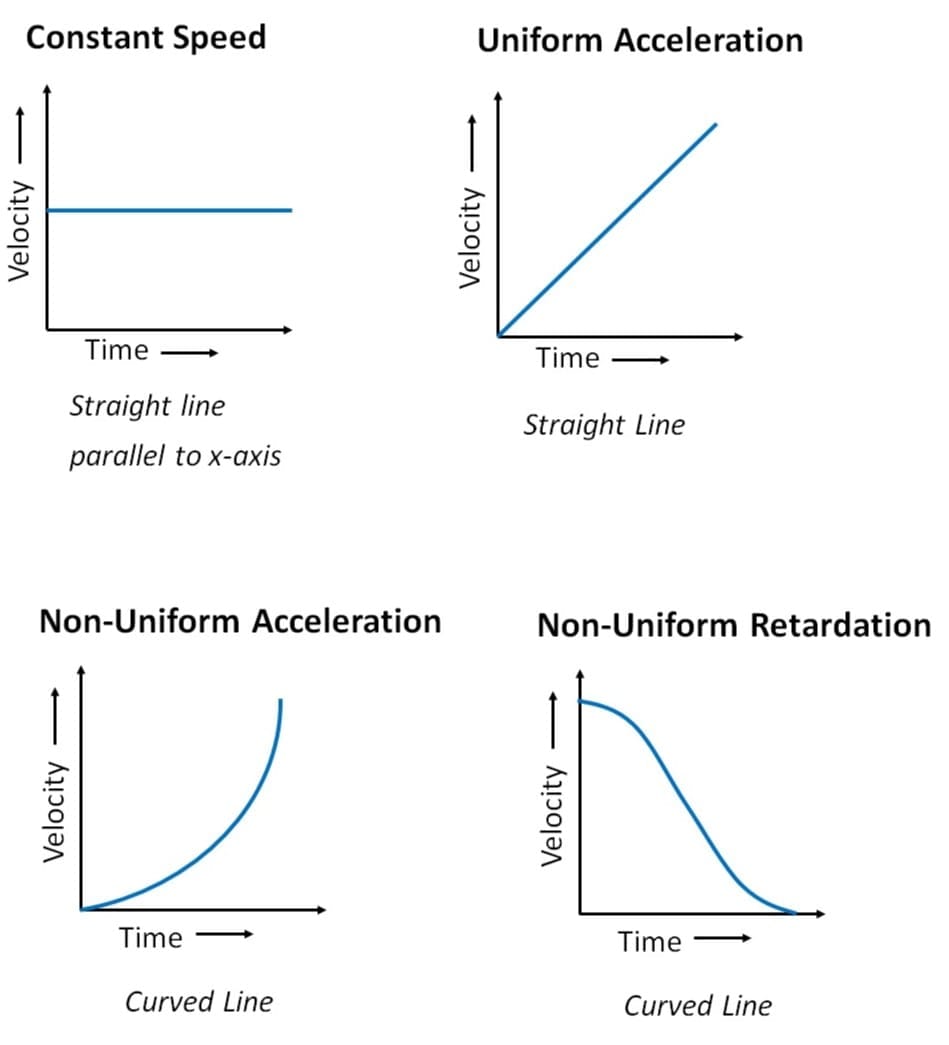
4.2.3 Velocity-Time Graphs
The velocity-time graph represents the change in velocity of an object with time.
What does the shape of the velocity-time graph indicate?
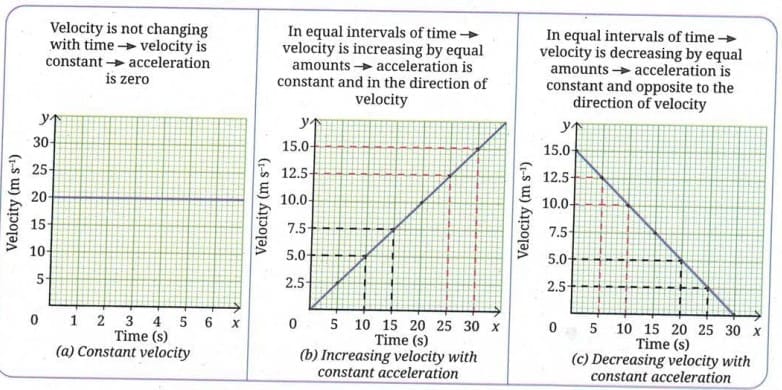
| Shape of Graph | Meaning |
|---|---|
| Straight line parallel to time axis (horizontal) | Constant velocity, zero acceleration |
| Straight line sloping upward | Velocity increasing with constant acceleration |
| Straight line sloping downward | Velocity decreasing with constant acceleration (opposite to velocity) |
Physical quantities from velocity-time graph:
- Slope of the line = acceleration
- a = (v - u) / (t₂ - t₁) = BC / CA
- Positive slope = acceleration in direction of velocity
- Negative slope = acceleration opposite to velocity
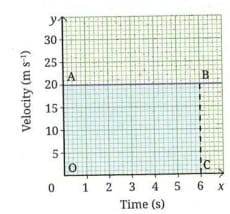
- Area enclosed between velocity-time graph and time axis = displacement
- For constant velocity: displacement = area of rectangle = velocity × time interval
- For changing velocity: displacement = area of trapezium/triangle under the line
Example calculations from chapter:
1. Calculate Displacement from the velocity time graph given below.
Ans: For constant velocity (v = 20 m s⁻¹, t = 6 s): displacement = 20 × 6 = 120 m
2. Calculate Acceleration from the velocity - time graph given below.
Ans: For acceleration from 5 m s⁻¹ to 10 m s⁻¹ over 10 s (from t = 10 s to 20 s): displacement = area of rectangle + area of triangle = (5 × 10) + (½ × 10 × 5) = 50 + 25 = 75 m
Similar to 'velocity at an instant', 'acceleration at an instant' is known as 'instantaneous acceleration'.
4.3 Kinematic Equations for Motion in a Straight Line with Constant Acceleration
For an object moving in a straight line with constant acceleration, five physical quantities are related:
- s = displacement
- t = time interval
- u = initial velocity (at t = 0)
- v = final velocity (at time t)
- a = acceleration (constant)
These five quantities are related by three kinematic equations:
Equation 1: v = u + at
Equation 2: s = ut + ½ at²
Equation 3: v² = u² + 2as
These are known as kinematic equations. They provide a mathematical description of how the motion of an object changes with time. Using these equations, it is possible to predict the position or velocity of the object at a future time.
Equations of Motion by Graphical Method
1. First Equation: v = u + at
Final velocity = Initial velocity + Acceleration × Time
Graphical Derivation
Suppose a body has initial velocity 'u' (i.e., velocity at time t = 0 sec.) at point 'A' and this velocity changes to 'v' at point 'B' in 't' secs. i.e., final velocity will be 'v'.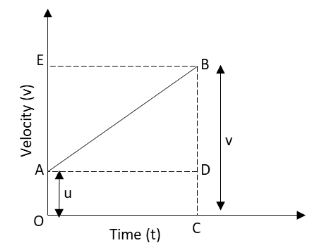
For such a body there will be an acceleration. a = Change in velocity/Change in Time
⇒ a = (OB - OA)/(OC-0) = (v-u)/(t-0)
⇒ a = (v-u)/t
⇒ v = u + at
2. Second Equation: s = ut + ½ at2
Distance travelled by object = Area of OABC (trapezium)
= Area of OADC (rectangle) + Area of ∆ABD
= OA × AD + ½ × AD × BD
= u × t + ½ × t × (v - u)
= ut + ½ × t × at
⇒ s = ut + ½ at2 (∵a = (v-u)/t)
3. Third Equation: v2 = u2 + 2as
s = Area of trapezium OABC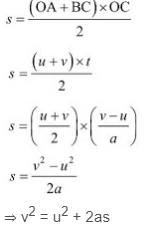
Important Note: These kinematic equations are valid only when the acceleration is constant. While using them for straight line motion in one direction, distance = magnitude of displacement, and speed = magnitude of velocity. In straight line motion in both directions, the sign of u, v, a, and s tells about direction.
Example 1: A car starting from rest moves with a uniform acceleration of 0.1 ms-2 for 4 mins. Find the speed and distance travelled.
Sol: u = 0 ms-1 (∵ car is at rest), a = 0.1 ms-2, t = 4 × 60 = 240 sec.
v = ?
From, v = u + at
v = 0 + (0.1 × 240) = 24 ms-1
Example 2: The brakes applied to a car produces a deceleration of 6 ms -2 in the opposite direction to the motion. If a car requires 2 sec. to stop after the application of brakes, calculate the distance travelled by the car during this time.
Sol: Deceleration, a = - 6 ms-2; Time, t = 2 sec.
Distance, s =?
Final velocity, v = 0 ms-1 (∵ car comes to rest)
Now, v = u + at
⇒ u = v - at = 0 - (-6×2) = 12 ms-1
s = ut + ½ at2 = 12 × 2 + ½ (-6 × 22) = 24 - 12 = 12 m
Bridging Science and Society
When a moving vehicle applies its brakes, it doesn't stop immediately. Instead, it travels a certain distance before coming to a complete stop. This stopping distance depends on several factors:
- Velocity: The speed of the vehicle when the brakes are applied plays a crucial role. Higher speeds result in longer stopping distances.
- Road Surface: The condition of the road surface, whether it's wet, dry, or icy, affects how quickly the vehicle can stop. For example, wet or icy roads increase stopping distances.
- Braking Capacity: This refers to the negative acceleration that the brakes can achieve. Different vehicles have different braking capacities, which impact how quickly they can stop.
- Driver's Reaction Time: The time it takes for the driver to react and apply the brakes also influences the stopping distance. A quicker reaction time leads to a shorter stopping distance.
Given these factors, it is essential to maintain a safe distance from the vehicle ahead. This distance needs to be adjusted based on your vehicle's initial velocity. For instance, at higher speeds, a greater distance is required to ensure safety. In many countries, including India, there is a developing technology called vehicle-to-vehicle (V2V) communication. This technology enables vehicles to exchange signals with each other, warning drivers of potential collisions and enhancing overall road safety.
4.4 Motion in a Plane
Motion in a plane (two dimensions) is when an object moves along a path that is not a straight line. Examples: a vehicle overtaking another, the path of a kicked ball, a satellite moving in a circular path.
4.4.1 Uniform Circular Motion
When an object moves in a circular path, its motion is called circular motion.
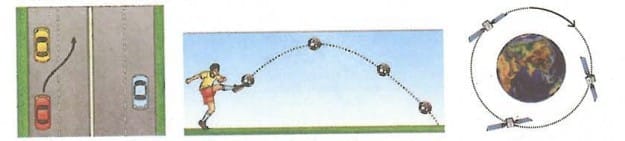
Consider a child on a merry-go-round moving from A to B to C on a circular path:
 Top view of merry-go-round in circular motion
- Distance travelled = curve ABC
- Displacement = straight line AC
- Both are not equal.
For one complete revolution:
- Distance travelled = circumference = 2πR (where R is the radius)
- Displacement = zero (since the object returns to its original position)
Average speed for one revolution:
vav = 2πR / T
where T = time taken for one revolution.
Average velocity for one complete revolution = 0 (since displacement = 0)
Uniform Circular Motion: When an object moves in a circular path with constant (uniform) speed, its motion is called uniform circular motion.
Key feature: In uniform circular motion:
- Speed is constant at every point on the circle
- But the direction of velocity changes continuously (velocity is along the tangent to the circle at each point)
- Since direction of velocity changes, the motion is accelerated even though speed is constant
- This is an example of acceleration due to change in direction alone (not change in speed)
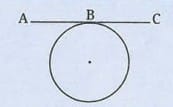
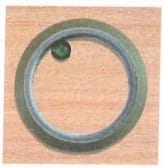
Activity 4.5 result: When a marble rolling inside a ring is released (ring is lifted), it moves in a straight line - because it continues in the direction it was moving at the instant of release (tangent to the circle). This confirms that velocity in circular motion is along the tangent.
Uniform circular motion is an idealised model - in real world, conditions of constant speed and perfectly circular path are often not met. But it serves as the foundation for understanding more complex real-world situations like planets revolving around the Sun.
Important Note:Motion in space, such as a car climbing up a mountain road, bird flying in the sky or an aircraft moving through air, is called motion in three Next dimensions.
In everyday life, we say that a vehicle is accelerating when the magnitude of its velocity is changing but we often fail to recognise that there can be acceleration when there is only a change in the direction of velocity.
AT A GLANCE - Summary
- The distance and direction of an object with respect to the reference point, at any instant of time, describes the position of the object at that instant.
- If position changes with time with respect to a reference point, the object is in motion.
- Displacement is the net change in the position of the object between two given instants of time.
- Average speed = total distance travelled / time interval
- Average velocity = displacement / time interval (vav = s/t)
- Average acceleration = change in velocity / time interval [a = (v - u) / t]
- For motion in a straight line with constant acceleration, the kinematic equations are:
Equation 1: v = u + at
Equation 2: s = ut + ½at²
Equation 3: v² = u² + 2as
- Slope of position-time graph = velocity
- Slope of velocity-time graph = acceleration
- Area under velocity-time graph = displacement
- When an object moves in a circular path with constant (uniform) speed, it is uniform circular motion. Speed is constant but direction of velocity changes continuously, so the object is accelerated.
FAQs on Chapter Notes: Describing Motion Around Us
| 1. What is meant by motion in a straight line? |  |
| 2. How can we graphically represent motion? | |
| 3. What are the kinematic equations for motion in a straight line with constant acceleration? | |
| 4. What distinguishes motion in a plane from motion in a straight line? | |
| 5. Why is understanding motion important in real life? | |


