The Demographic Structure of the Indian Society Class 12 Sociology

Introduction
Demography is the study of population trends and processes, including changes in population size, birth and death patterns, migration, and population structure.
- Derivation of the word: The term "demography" comes from Greek: "demos" meaning "people" and "graphein" meaning "to describe," indicating the focus on describing people.
- Methods of Study: Demographic studies use methods such as census and surveys to systematically gather information about a population.
- Relation to Sociology: Demography is closely related to sociology and has significantly influenced its development. The growth of modern statistics and nation-states in late 18th-century Europe played a key role in this.
- Government Use: Governments use demographic data to formulate and implement policies, address economic growth, and improve general welfare.
- Aggregate Statistics: These statistics from large populations help identify and explain social phenomena and trends.
Two forms of demography exist:
- Formal Demography employs statistical analysis of population data, such as the overall population size, gender ratio, ratio of youth to working-age individuals, and rural-urban distribution (based on quantitative data).
- Social Demography concerns a society's migration patterns, birth and death rates, and other demographic factors. It is focused on the consequences of population changes and how they impact society, utilizing data, totals, and statistics.
Some Theories and Concepts in Democracy
1. The Malthusian Theories of Population Growth
- Thomas Robert Malthus developed the Malthusian Theory, which argues that human populations grow at a faster rate than the means of human subsistence, such as food, clothing, and other agricultural products.
- Malthus’ theory highlights the challenges of managing population growth and resource production, suggesting that without effective controls, humanity will face ongoing poverty and scarcity due to the inherent imbalance between population growth and agricultural production.
Main Points of the Malthusian theory:
1. Disparity in Growth Rates:
Malthus asserts that population growth follows a geometric pattern (e.g., 2, 4, 8, 16), while agricultural output increases only in an arithmetic pattern (e.g., 1, 2, 3, 4). As a result, the population will always outstrip the growth of agricultural production, leading to a perpetual state of poverty.
2. Implications for Prosperity:
According to Malthus, the only way to increase prosperity is by controlling population growth, as the expansion of population always outpaces the production of necessary resources.
3. Challenges in Controlling Population:
Limiting population growth is difficult because there are only a limited number of "preventive checks" that can be implemented, such as:
- Postponing marriage
- Sexual abstinence or celibacy
4. Role of Natural Checks:
Malthus argues that natural checks like famines and diseases are inevitable as they help balance the imbalance between food availability and the growing population.
 Thomas Robert MalthusObjections to the Malthusian Theory
- Sociologists argue that poverty, hunger, and other social problems are caused by unequal distribution of economic resources, not by a decrease in agricultural productivity.
- The advancement of science and technology has not limited agricultural output.
- As population growth has increased, the standard of living has also risen. Technology and science are credited for this progress.
- Malthus faced criticism from liberal and Marxist intellectuals for attributing poverty to population growth. These critics argued that poverty and hunger were the result of an inequitable distribution of economic resources rather than population expansion.
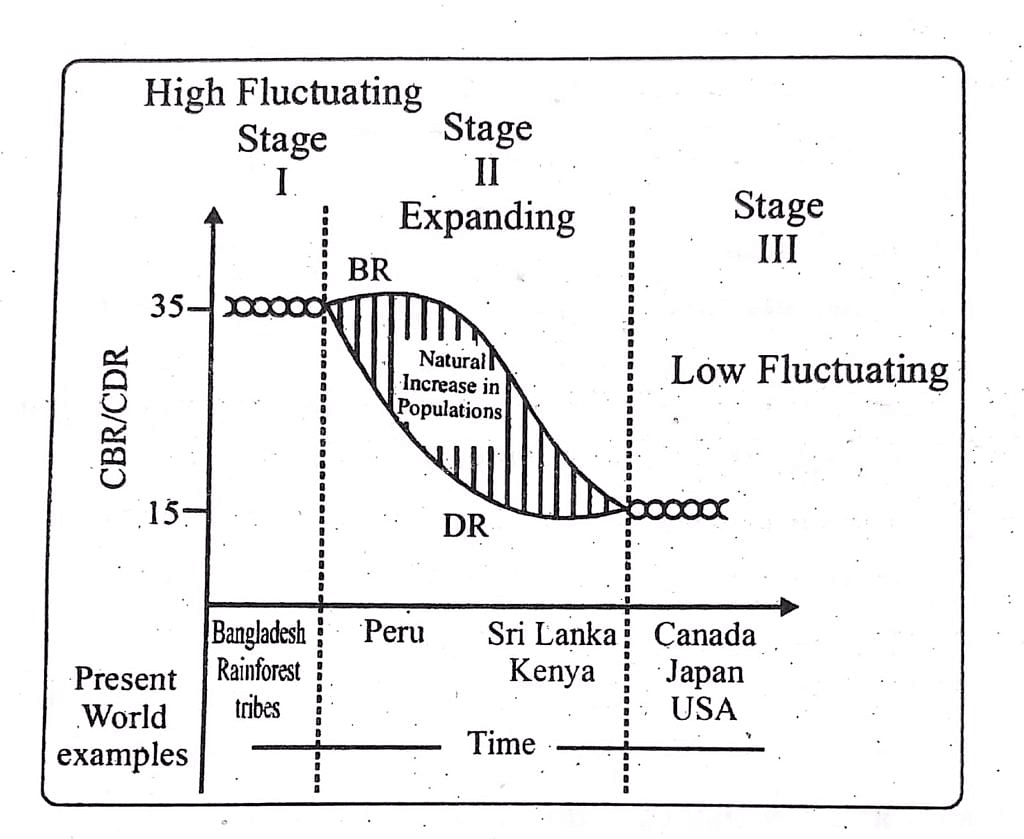
2. The Theory of Demographic Transition
It can be observed that population growth is generally associated with economic development across all cultures.
The three basic stages of population increase can be identified as follows:
 The Theory of Demographic Transition
First Stage: High Birth and Mortality Rates
1. Characteristics: Slow population growth due to a significant gap between high birth and mortality rates in a backward and impoverished society.
2. Factors:
- High birth rates are driven by a lack of education and awareness about the benefits of smaller families.
- High mortality rates are caused by a lack of healthcare services.
3. Result: The combination of high birth and death rates results in a low overall population.
Second Stage: Population Explosion
1. Characteristics: This stage marks the transition from a backward society to an advanced one, characterized by extremely high population growth rates.
2. Factors:
- High birth rates continue due to the patriarchal nature of society, where males often determine family size and favor having male children.
- Death rates drop significantly with the increased availability of healthcare and medical services.
3. Result: A population explosion occurs, creating a demographic divide where the working population grows faster than the non-working population.
Third Stage: Stabilization and Modest Growth
1. Characteristics: In a developed society, this stage is characterized by modest population growth with slightly reduced birth and mortality rates.
2. Factors:
- Low birth rates are due to greater awareness, education, and the widespread acceptance of birth control.
- Low death rates continue due to the availability of health and medical services.
3. Result: The population remains stable with modest growth rates.
Common Concepts and Indicators
- Demographic Rates and Ratios: Most demographic concepts are expressed as rates or ratios
- Birth Rate: Number of live births per 1,000 population.
- Death Rate: Number of deaths per 1,000 population.
- Rate of Natural Increase (Growth Rate): Refers to the difference between the birth rate and the death rate.
- Fertility Rate: Number of live births per 1,000 women aged 15 to 49.
- Infant Mortality Rate: Deaths of babies under one year per 1,000 live births.
- Maternal Mortality Rate: Number of women who die in childbirth per 100,000 live births. High rates signal poor development and poverty; reductions suggest improvements in medical care and living standards.
- Life Expectancy: Estimated number of years an average person is expected to live, based on age-specific death rates. It Reflects overall health and development levels.
- Sex Ratio: Number of females per 1,000 males in a given area.
- Age Structure of the Population: Refers to the proportion of people in different age groups relative to the total population.
- Dependency Ratio: Ratio of dependents (children under 15 and elderly over 64) to the working-age population (15-64 years).
Size and Growth of India's Population
Current Status of India's Population: India is the second most populous country with a population of 121 crores (1.21 billion) as per the 2011 Census of India.
Historical Population Growth
- 1901-1951: The average annual population growth rate was 1.33%.
- 1911-1921: A negative growth rate of -0.03% occurred due to the 1918-19 influenza epidemic, which caused approximately 12.5 million deaths.
- Post-Independence (1961-1981): The growth rate increased to 2.2%. Although it has decreased in recent years, it remains high compared to other developing countries.
Demographic Transition
Post-1921: The death rate decreased sharply, largely due to improved control over famines and epidemic diseases, while the birth rate declined more slowly.
Factors in Death Rate Decline:
- Better management of famines and epidemics reduced mortality rates.
- Although significant diseases like malaria, tuberculosis, diarrhoea, and dysentery still pose challenges, overall health has improved.
Factors in Famine Reduction:
- Improvements in agriculture, transportation, and state relief measures have greatly reduced famine-related deaths.
- Despite this, starvation deaths continue in some backward regions, with initiatives like the Mahatma Gandhi National Rural Employment Guarantee Act addressing these issues.
Birth Rate Trends
- Slower Decline in Birth Rates: The birth rate has not declined as rapidly as the death rate due to sociocultural factors. However, factors like higher prosperity, reduced infant mortality, and increased education are contributing to lower birth rates.
Fertility Rates Across States
- Below Replacement Level TFR: States like Andhra Pradesh, Himachal Pradesh, Punjab, Tamil Nadu, and West Bengal have a Total Fertility Rate (TFR) of 1.7, below the replacement level. Kerala also has a TFR below replacement level, indicating potential future population decline.
- Higher TFR States: Bihar (3.3), Madhya Pradesh (2.8), Rajasthan (2.7), and Uttar Pradesh (3.1) have higher fertility rates, contributing significantly to population growth.
Birth Rates as of 2020
- National Average: India's crude birth rate is 19.5.
- Rural vs Urban: The birth rate in rural areas is 21.1, while in urban areas it is 16.1.
- Highest Birth Rates: Bihar (25.5) and Uttar Pradesh (25.1) have the highest birth rates in the country.
Future Projections
- Growth Contribution: Projections suggest that Bihar and Uttar Pradesh will account for nearly 50% of India's population growth up to 2041, with Uttar Pradesh alone contributing about 22% of this increase.
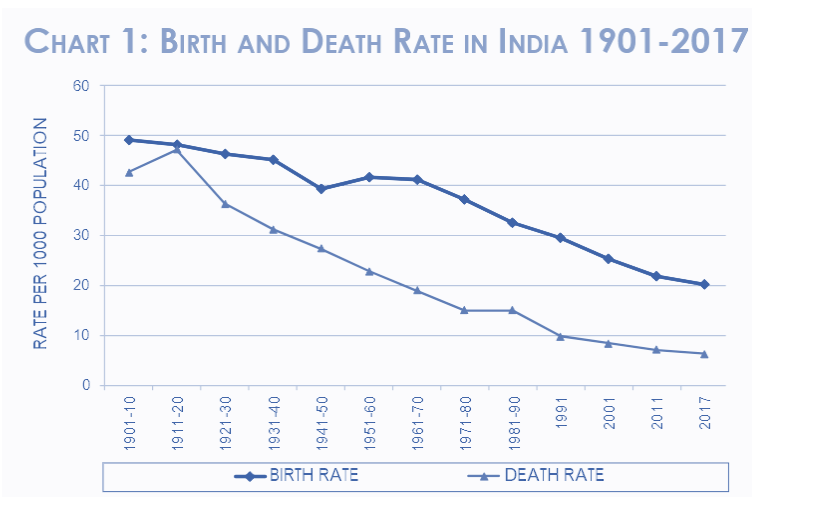 Birth and Death Rate in India: 1901-2017
 Regional Shares of Projected Population Growth upto 2041
Age Structure of the Indian Population
India has a very young population with the average age being lower than that of many other countries.
The share of the under-15 age group in the total population decreased from 42% in 1971 to 29% in 2011.
The share of the 15–59 age group increased from 53% to 63% over the same period.
The share of the 60+ age group is small but rising, from 5% to 7% between 1971 and 2011.
Regional Variations:
- Kerala is developing an age structure similar to that of developed countries.
- Uttar Pradesh has high proportions in younger age groups and lower proportions among the aged.
- India as a whole is in between, reflecting the diversity of states like Uttar Pradesh and Kerala.
Demographic Dividend:
- India’s large working-age population compared to a smaller older population is seen as an advantage, similar to the past experience of East Asian economies and Ireland.
This demographic dividend can offer significant benefits but requires conscious exploitation through appropriate policies to be fully realized.
A population pyramid is a graphical representation that shows the distribution of a population by age and gender. It looks like a pyramid, with the age groups arranged on the vertical axis and the population size on the horizontal axis.
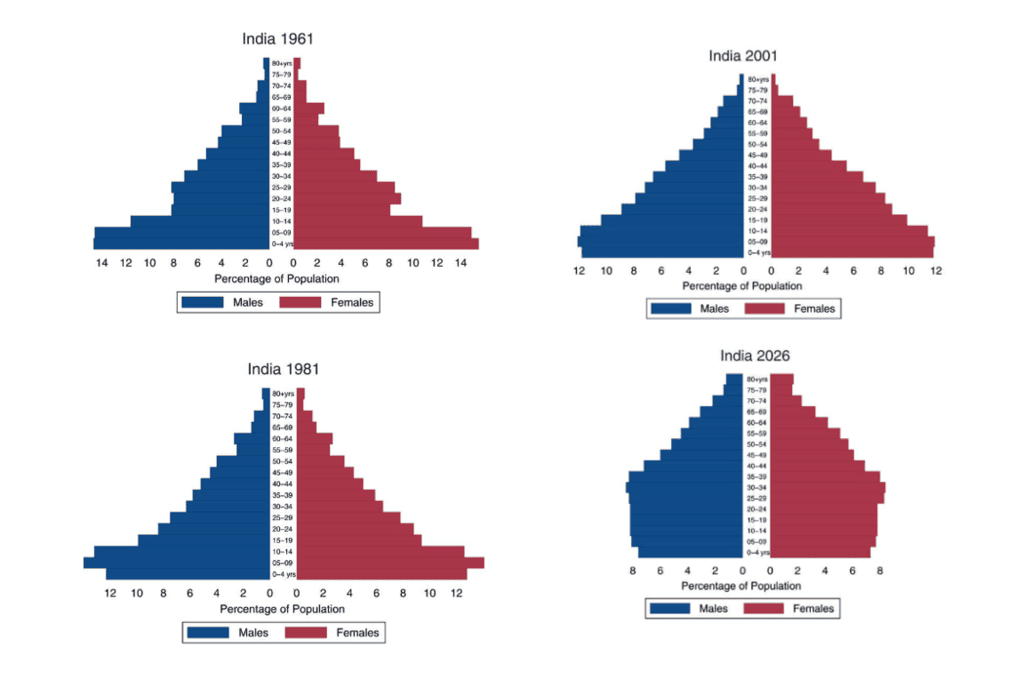 India's Population Pyramids: 1961, 1981, 2001 and 2026
The Declining Sex-Ratio in India

Importance:
The sex ratio is a critical indicator of gender balance in a population. Historically, India had a sex ratio slightly in favor of females, with more females per 1,000 males.
Trends in Sex Ratio
1. Historical Decline:
- Early 20th Century: At the turn of the 20th century, India had a sex ratio of 972 females per 1,000 males.
- Late 20th Century: By the turn of the 21st century, the sex ratio had declined to 933 females per 1,000 males.
- 1961-1991: The sex ratio fell from 941 to an all-time low of 927.
- 2011 Census: The sex ratio increased slightly to 943 females per 1,000 males.
2. Child Sex Ratio:
The child sex ratio (age 0–6 years) has seen a sharper decline:
- 1991: 945 females per 1,000 males.
- 2001: Dropped to 927 females per 1,000 males.
- 2011: Further decreased to 919 females per 1,000 males, marking the first time it fell below the overall sex ratio in 2001.
 Declining Sex Ratio in India: 1901-2011
Regional Disparities in Child Sex Ratios
1. Lowest Ratios:
- Nine states and union territories have a child sex ratio below 900 females per 1,000 males, with Haryana having the lowest at 793.
- Other regions with very low child sex ratios include Punjab, Jammu & Kashmir, Delhi, Chandigarh, Uttarakhand, and Himachal Pradesh.
2. Below National Average:
- States like Uttar Pradesh, Daman & Diu, Himachal Pradesh, Lakshadweep, and Madhya Pradesh have ratios below 925.
3. Above National Average but Below 970:
- Large states such as West Bengal, Assam, Bihar, Tamil Nadu, Andhra Pradesh, and Karnataka fall in this range.
- Kerala has a sex ratio of 964, while Arunachal Pradesh has the highest at 972.
Reasons for Decline in Sex Ratio
1. Neglect and Higher Death Rates of Girls: Increased neglect of girl babies leads to higher mortality rates among female infants.
2. Sex-Selective Abortions and Female Infanticide: The misuse of prenatal diagnostic techniques, such as sonograms, to identify and abort female fetuses has significantly contributed to the decline.
3. Economic Prosperity and Sex Selection:
- Low child sex ratios are often seen in economically prosperous regions like Maharashtra, Punjab, Haryana, Chandigarh, and Delhi. This suggests that the issue is not solely due to poverty or ignorance.
- Some prosperous families prefer fewer children and may use ultrasound technology to choose the sex of their child.
Legal and Policy Measures
1. Legal Action: The Prenatal Diagnostic Techniques (Regulation and Prevention of Misuse) Act, implemented in 1996 and strengthened in 2003, aims to curb the misuse of ultrasound technology for sex selection.
2. Government Initiatives: The Government of India has introduced the ‘Beti-Bachao, Beti-Padhao’ program to improve the child sex ratio and address gender imbalances, reflecting ongoing efforts to tackle these issues through policy initiatives.
Literacy
Literacy is a key prerequisite to education and serves as a powerful tool for empowerment. It enables individuals to:
- Explore a wider range of career options.
- Participate actively in the knowledge economy.
- Increase health awareness.
- Contribute more fully to the cultural and economic well-being of their communities.

Trends in Literacy Rates
Post-Independence Improvement: Literacy levels in India have improved significantly since independence, with nearly two-thirds of the population now literate. However, the rate of improvement has struggled to keep pace with the rapid growth of the Indian population.
Gender Disparities:- The literacy rate for women is 16.3% lower than that for men.
- Female literacy is rising faster than male literacy, with a 10.4% increase for women between 2001 and 2011, compared to a 7.6% increase for men.
- From 2001 to 2011, overall literacy increased by approximately 8%, with male literacy rising about 5% and female literacy about 10%.
Variations Across Regions and Social Groups
1. Social Disparities:
- Historically disadvantaged communities, such as Scheduled Castes and Scheduled Tribes, have lower literacy rates, with female literacy in these groups even lower.
2. Regional Variations:
- States like Kerala are approaching universal literacy.
- States like Bihar have much lower literacy rates, highlighting significant regional disparities.
Implications of Literacy Inequality
Reproduction of Inequality: Inequalities in literacy rates contribute to the perpetuation of inequality across generations. Illiterate parents often face challenges in providing their children with quality education, further entrenching existing disparities.
Rural - Urban Differences
Rural vs. Urban Population in India
Rural Population:
- Historically, the majority of India’s population has lived in rural areas.
- Census of India 2011: 68.8% of the population resides in rural areas, while 31.2% live in urban areas.
Urban Population Trends:
- Early 20th Century: Urban population was around 11%.
- Early 21st Century: Increased to approximately 28%.
Changes and Trends
1. Economic and Social Shifts:
- Modern development has diminished the economic and social importance of the agrarian-rural lifestyle compared to the industrial-urban way of life.
- Agriculture now contributes about one-sixth of India's Gross Domestic Product (GDP).
2. Rural to Urban Migration:
- Many rural residents are transitioning from agriculture to non-farm occupations such as transport services, business enterprises, and craft manufacturing.
- Some individuals commute to urban centers for work while continuing to live in villages.
3. Influence of Modern Media:
- Mass media and communication are bringing urban lifestyles and consumption patterns to rural areas, creating new desires and aspirations.
- Improved mass transit and communication are bridging the gap between rural and urban areas.
Urbanization and Migration
1. Urban Attraction:
- Urban areas serve as magnets for rural populations seeking employment opportunities.
- Migration is accelerated by the decline of common property resources like ponds, forests, and grazing lands, which previously supported rural livelihoods.
2. Challenges in Rural Areas:
- The decline in common resources has increased hardship in rural areas.
- Cities offer social advantages and anonymity, making them attractive destinations for marginalized groups.
3. Growth of Large Cities:
- The largest cities, or metropolises, are growing rapidly, attracting migrants from rural areas and smaller towns.
- Current Statistics: There are 5,161 towns and cities in India. Over two-thirds of the urban population lives in 27 cities with populations exceeding one million.
Urban vs. Rural Dynamics
- Infrastructure Strain: Rapid growth in large cities is outpacing the development of urban infrastructure.
- Political Power: Despite urbanization, rural areas continue to hold significant political power.
Population Policy in India

- Population dynamics are crucial for developmental prospects and well-being, especially in developing countries.
- India has had an official population policy since 1952.
- The National Family Planning Programme was created to influence population growth, improve public health, and increase awareness.
- Significant progress in population management has been achieved over the past fifty years.
- During the National Emergency (1975–76), there was a setback due to a coercive mass sterilization campaign, involving forced sterilizations and widespread opposition.
- After the Emergency, the programme was renamed to the National Family Welfare Programme, which emphasized non-coercive methods and broader socio-demographic objectives.
- The National Population Policy 2000 introduced new guidelines and targets, later incorporated into the National Health Policy 2017.
- Population policies show that while the state can influence demographic change, many factors, particularly those related to human fertility, are influenced by broader economic, social, and cultural changes.
Conclusion
Demography reveals crucial patterns in human life and societal change. As India's population dynamics evolve, understanding these trends helps craft effective policies. From early population strategies to contemporary transitions, the field underscores the need for adaptable approaches that address economic, social, and cultural factors shaping demographic shifts.
|
62 videos|143 docs|25 tests
|
FAQs on The Demographic Structure of the Indian Society Class 12 Sociology
| 1. What are some common concepts and indicators related to the demographic structure of Indian society? |  |
| 2. How has the sex ratio in India been declining over the years? | |
| 3. What is the significance of the age structure of the Indian population? | |
| 4. How do rural-urban differences impact the demographic structure of Indian society? | |
| 5. What are some key components of population policy in India? | |


mock tests for examination
,Sample Paper
,Free
,Viva Questions
,The Demographic Structure of the Indian Society Class 12 Sociology
,The Demographic Structure of the Indian Society Class 12 Sociology
,MCQs
,Summary
,ppt
,Previous Year Questions with Solutions
,Semester Notes
,Exam
,Important questions
,practice quizzes
,Extra Questions
,study material
,past year papers
,shortcuts and tricks
,The Demographic Structure of the Indian Society Class 12 Sociology
,video lectures
,Objective type Questions
;


Chapter Notes - The Demographic Structure of the Indian Society Free PDF Download
Importance of Chapter Notes - The Demographic Structure of the Indian Society
Chapter Notes - The Demographic Structure of the Indian Society
Chapter Notes - The Demographic Structure of the Indian Society Humanities/Arts Questions
Study Chapter Notes - The Demographic Structure of the Indian Society on the App
|
© EduRev
|
Education Revolution
|


|


