Accounting Ratios NCERT Solutions | Accountancy Class 12 - Commerce PDF Download
Short Answer Questions
Q1: What do you mean by Ratio Analysis?
Ans:
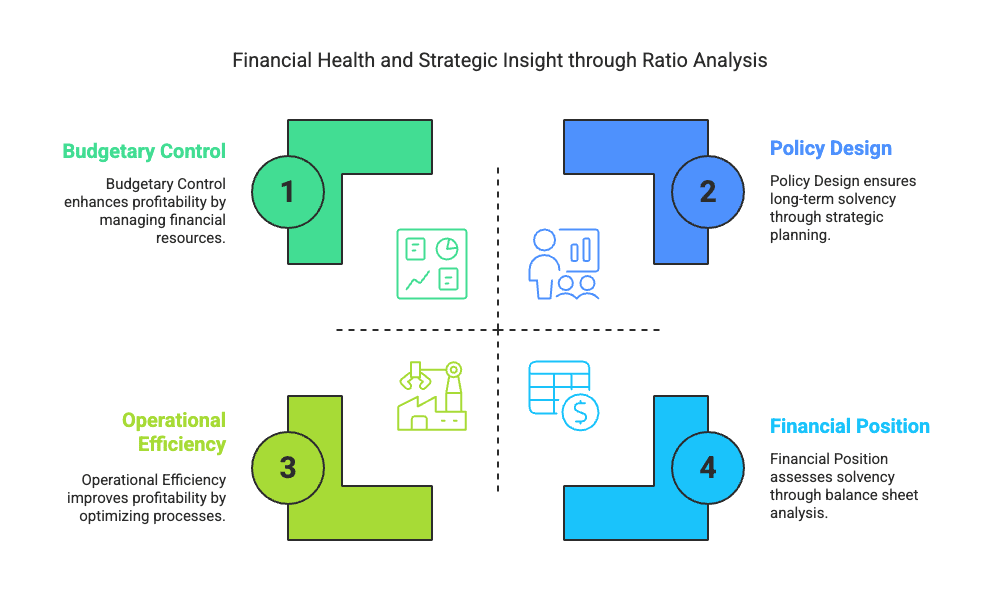
- Ratio Analysis is a technique used in financial analysis that describes the relationship between various items found in the Balance Sheet and Income Statements.
- This analysis helps in ascertaining the profitability, operational efficiency, and solvency of a firm.
- It can be expressed in different forms, such as fractions, proportions, percentages, or times.
- By evaluating the qualitative relationships among various financial variables, Ratio Analysis enables effective budgetary control.
- This technique provides vital information to various accounting users regarding the financial position, viability, and performance of a firm.
- Additionally, it lays down a fundamental framework for decision-making and policy design by management.
Q2: What are the various types of ratios?
Ans: Accounting ratios are classified in the following two ways.
I. Traditional Classification
II. Functional Classification
1. Traditional Classification: This classification is based on the financial statements, specifically the Profit and Loss Account and the Balance Sheet. The Traditional Classification further divides accounting ratios based on the accounts to which the elements of a ratio belong:
- Income Statement Ratios: These ratios consist solely of elements from the Trading and Profit and Loss Account, such as the Gross Profit Ratio.
- Balance Sheet Ratios: These ratios are comprised entirely of elements from the Balance Sheet, including the Current Ratio and Debt Equity Ratio.
- Composite Ratios: These ratios include elements from both the Trading and Profit and Loss Account as well as the Balance Sheet, such as the Debtors Turnover Ratio.
2. Functional Classification: This classification reflects the functional needs and purposes of calculating ratios. The primary rationale for computing ratios is to assess liquidity, solvency, financial performance, and profitability of a business. Thus, the Functional Classification of accounting ratios includes:
- Liquidity Ratio: These ratios are calculated to determine short-term solvency.
- Solvency Ratio: These ratios assess long-term solvency.
- Activity Ratio: These ratios measure the operational efficiency and effectiveness of operations, relating to sales or cost of goods sold.
- Profitability Ratio: These ratios evaluate the financial performance and viability of a business.
Q3: What relationships will be established to study:
a. Inventory Turnover
b. Debtor Turnover
c. Payables Turnover
d. Working Capital Turnover.
Ans: a. Inventory Turnover Ratio: This ratio is computed to determine the efficiency with which the stock is used. This ratio is based on the relationship between the cost of goods sold and the average stock kept during the year.
b. Debtors Turnover Ratio or Trade Receivable Turnover Ratio: This ratio is computed to determine the rate at which the amount is collected from the debtors. It establishes the relationship between net credit sales and average accounts receivables.

c. Trade Payables Turnover Ratio: This ratio is known as Creditors Turnover Ratio. It is computed to determine the rate at which the amount is paid to the creditors. It establishes the relationship between net credit purchases and average accounts payable.

d. Working Capital Turnover Ratio: This ratio is computed to determine how efficiently the working capital is utilised in making sales. It establishes the relationship between net sales and working capital.

Q4: The liquidity of a business firm is measured by its ability to satisfy its long-term obligations as they become due. What are the ratios used for this purpose?
Ans: The liquidity of a business firm is measured by its ability to pay its long-term obligations. These obligations include the payment of the principal amount on the due date and regular interest payments. The long-term solvency of any business can be assessed using the following ratios:
a. Debt-Equity Ratio- This ratio depicts the relationship between borrowed funds and owner's equity. A lower debt-equity ratio indicates a higher degree of security for lenders, suggesting that the company can easily meet its long-term obligations.

b. Total Assets to Debt Ratio- It shows the relationship between the total assets and the long-term loans. A high Total Assets to Debt Ratio implies that more assets are financed by the owner's fund and the company can easily meet its long-term obligations. Thus, a higher ratio implies more security to the lenders.

c. Interest Coverage Ratio- This ratio depicts the relationship between the amount of profit utilised for paying interest and the amount of interest payable. A high Interest Coverage Ratio implies that the company can easily meet all its interest obligations out of its profit.

Q5: The average age of inventory is viewed as the average length of time inventory is held by the firm or as the average number of day's sales in inventory. Why?
Ans: Inventory Turnover Ratio: This ratio is computed to determine the efficiency with which the stock is used. This ratio is based on the relationship between cost of goods sold and the average stock kept during the year.

It shows the rate with which the stock is turned into sales or the number of times the stock in turned into sales during the year. In other words, this ratio reveals the average length of time for which the inventory is held by the firm.
Long Answer Questions
Q1: What are liquidity ratios? Discuss the importance of the current and liquid ratio.
Ans: Liquidity ratios are calculated to determine the short-term solvency of a business, i.e. the ability of the business to pay back its current dues. Liquidity means the easy conversion of assets into cash without any significant loss and delay.
Short-term creditors are interested in ascertaining liquidity ratios for the timely payment of their debts.
The liquidity ratio includes
1. Current Ratio
2. Liquid Ratio or Quick Ratio
1. Current Ratio- It explains the relationship between current assets and current liabilities. It is calculated as:

Current assets are those assets that can be easily converted into cash within a short period of time, like cash in hand, cash at bank, marketable securities, debtors, stock, bills receivables, and prepaid expenses. etc.
Current Liabilities are those liabilities that are to be repaid within a year, like bank overdraft, bills payables, Short-term creditors, provision for tax, outstanding expenses, etc.
Importance of Current Ratio
It helps in assessing the firm's ability to meet its current liabilities on time. The excess of current assets over current liabilities provides a sense of safety and security to the creditors. The ideal ratio of current assets over current liabilities is 2:1. It means that the firm has sufficient funds to meet its current liabilities. A higher ratio indicates poor investment policies of management, and a low ratio indicates a shortage of working capital and a lack of liquidity.
2. Liquid Ratio- It explains the relationship between liquid assets and current liabilities. It indicates whether a firm has sufficient funds to pay its current liabilities immediately. It is calculated as:

Liquid Assets = Current Assests - Stock - Prepaid Expenses
Importance of Liquid Ratio
It helps in determining whether a firm has sufficient funds if it has to pay all its current liabilities immediately.
It does not include stock since it takes comparatively more time to convert the stock into cash. Further prepaid expenses are also not included in liquid assets since these cannot be converted into cash. The ideal Liquidity Ratio is considered to be 1:1. It means that the firm has a rupee in the form of liquid assets for every rupee of current liabilities.
Q2: How would you study the solvency position of the firm?
Ans: The solvency position of a firm is studied with the help of the Solvency Ratios. Solvency ratios are the measures of the long-term financial position of the firm in terms of its ability to pay its long-term liabilities. In other words, the solvency of the firm is measured by its ability to pay its long-term obligation on the due date. The long-term obligations include payments of the principal amount on the due date and payments of interest on a regular basis. The long-term solvency of any business can be calculated on the basis of the following ratios.
a. Debt-Equity Ratio- It depicts the relationship between the borrowed funds and the owner's funds. The lower the debt-equity ratio higher the degree of security to the lenders. A low debt-equity ratio implies that the company can easily meet its long-term obligations.

Equity or the Shareholders Fund includes Preference Share Capital, Equity Share Capital, Capital Reserve, Securities Premium, General Reserve less Accumulated Loss and Fictitious Assets.
b. Total Assets to Debt Ratio- It shows the relationship between the total assets and the long-term loans. A high Total Assets to Debt Ratio implies that more assets are financed by the owner's fund and the company can easily meet its long-term obligations. Thus, a higher ratio implies more security to the lenders.
Total Assets include all fixed and current assets except fictitious assets like Preliminary Expenses, Underwriting Commission, etc.
Debt includes all long-term loans that are to be repaid after one year. It includes debentures, mortgage loans, bank loans, loans from other financial institutions, etc.
c. Interest Coverage Ratio- This ratio depicts the relationship between the amount of profit utilised for paying interest and the amount of interest payable. A high Interest Coverage Ratio implies that the company can easily meet all its interest obligations out of its profit.

d. Proprietary Ratio- It shows the relationship between the Shareholders Fund and the Total Assets. This ratio reveals the financial position of a business. The higher the ratio, the higher the degree of safety for the creditors. It is calculated as:
Total Assets include all fixed and current assets except fictitious assets like Preliminary Expenses, Underwriting Commission, etc.
Q3: What are various profitability ratios? How are these worked out?
Ans: Profitability ratios are calculated on the basis of profit earned by a business. This ratio gives a percentage measure to assess the financial viability, profitability and operational efficiency of the business. The various important Profitability Ratios are as follows:
1. Gross Profit Ratio
2. Operating Ratio
3. Operating Profit Ratio
4. Net Profit Ratio
5. Return on Investment or Capital Employed
6. Earnings per Share Ratio
7. Dividend Payout Ratio
8. Price Earnings Ratio
1. Gross Profit Ratio- It shows the relationship between Gross Profit and Net Sales. It depicts the trading efficiency of a business. A higher Gross Profit Ratio implies a better position of a business, whereas a low Gross Profit Ratio implies an inefficient unfavourable sales policy.
2. Operating Ratio- It shows the relationship between Cost of Operation and Net Sales. This ratio depicts the operational efficiency of a business. A low Operating Ratio implies higher operational efficiency of the business. A low Operating Ratio is considered better for the business as it enables the business to be left with a greater amount after covering its operation costs to pay for interests and dividends. 
3. Operating Profit Ratio- It shows the relationship between the Operating Profit and Net Sales. It helps in assessing the operational efficiency and the performance of the business.
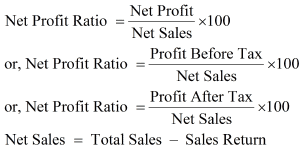
4. Net Profit Ratio- It shows the relationship between net profit and sales. A higher ratio is better for the firm. It depicts the overall efficiency of a business and acts as an important tool for investors for analysing and measuring the viability and performance of the business.
5. Return on Investment or Capital Employed- It shows the relationship between the profit earned and the capital employed to earn that profit. It is calculated as:
This ratio depicts the efficiency with which the business has utilised the capital invested by the investors. It is an important yardstick to assess the profit-earning capacity of the business.
6. Earning per Shares- It shows the relationship between the amount of profit available to distribute as dividends among the equity shareholders and a number of equity shares.

7. Dividend Payout Ratio- It shows the relationship between the dividend per share and earnings per share. This ratio depicts the amount of earnings that is distributed in the form of dividends among the shareholders. A high Dividend Payout Ratio implies a better position and goodwill of the business for the shareholders.

8. Price Earning Ratio- It shows the relationship between the market price of a share and the earnings per share. This ratio is the most common tool that is used in the stock markets. This ratio depicts the degree of reliance and trust that the shareholders have on the business. This ratio reflects the expectation of the shareholders regarding the rise in the future prices of the company's shares. A higher Price Earning Ratio definitely enables a company to enjoy a favourable position in the market.

Q4: The current ratio provides a better measure of overall liquidity only when a firm's inventory cannot easily be converted into cash. If inventory is liquid, the quick ratio is a preferred measure of overall liquidity. Explain.
Ans: Current Ratio- It explains the relationship between current assets and current liabilities. It is calculated as:
Current assets are those assets that are easily converted into cash within a short period of time, like cash in hand, cash at bank, marketable securities, debtors, stock, bills receivables, and prepaid expenses. etc.
Current Liabilities are those liabilities that are to be repaid within a year, like bank overdraft, bills payables, Short-term creditors, provision for tax, outstanding expenses, etc.
Liquid Ratio- It explains the relationship between liquid assets and current liabilities. It indicates whether a firm has sufficient funds to pay its current liabilities immediately. It is calculated as:
Generally, the Current Ratio is preferable for such types of business where the stock or the inventories cannot easily be converted into cash, like heavy machinery manufacturing companies, locomotive companies, etc. This is because the heavy stocks like machinery, heavy tools etc. cannot be easily sold off. On the other hand, the businesses where the stock can be easily realised or sold off regard Liquid Ratio to be a more suitable measure to reveal their liquidity position. For example, the inventories of a service sector company is very liquid as there are no stock kept for sale, so they prefer the Liquid Ratio as a measure of overall liquidity.
Moreover, sometimes companies prefer to resort to the Liquid Ratio instead of the Current Ratio if the prices of the stock held are prone to fluctuate. This is because if the prices of the inventories fluctuate more, then this may affect their liquidity position of the business and may reduce (or overcast) the Current Ratio. Consequently, they prefer the Liquid Ratio as it excludes inventories and stocks.
Thirdly, if the stock forms the major portion of a company's current assets, then they would prefer the Current Ratio and not the Liquid Ratio. This is because their current assets mostly consist of stock. The Liquid Ratio of such a company will be very low as liquid assets exclude stock. This will reduce their Liquid Ratio and may create a bad image for the creditors. In such a case, the Current Ratio provides a better measure of overall liquidity.
Numerical Questions
Q1: Following is the Balance Sheet of Raj Oil Mills Limited as at March 31, 2017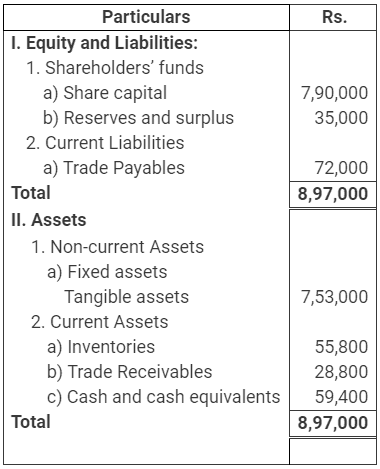 Calculate Current Ratio.
Ans:
Current Ratio = Current Assets/Current Liabilities= 144000/72000= 2:1
Current Assets = Inventories + Trade Receivables + Cash
= 55800 + 28800 + 59400
= Rs.144000
Current Liabilities = Trade Payables= Rs.72000
Q2: Following is the Balance Sheet of Title Machine Ltd. as at March 31, 2017. 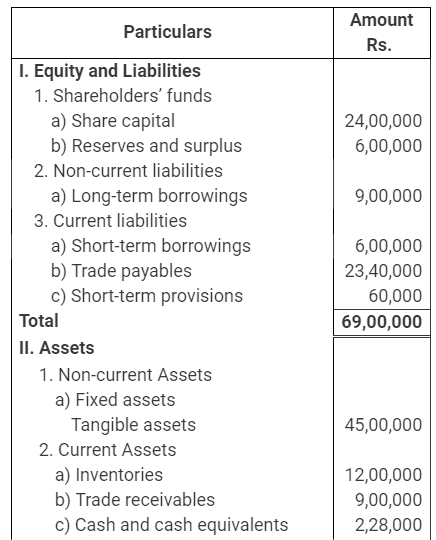

Calculate Current Ratio and Liquid Ratio.
Ans:
1. Current Ratio = Current Assets/Current Liabilities
= 2400000/3000000= 0.8:1
Current Assets = Inventories + Trade Receivables + Cash + Short Term Loans and Advances
= 1200000 + 900000 + 228000 + 72000= Rs. 2400000
Current Liabilities = Trade Payables + Short Term Borrowings + Short Term Provisions
= 2340000 + 600000 + 60000= Rs. 3000000
2. Liquid Ratio = Liquid Assets/Current Liabilities= 1200000/3000000= 0.4:1
Liquid Assets = Trade Receivables + Cash + Short Term Loans and Advances
= 900000 + 228000 + 72000= Rs. 1200000
Q3: Current Ratio is 3.5:1 Working Capital is Rs. 9,00,000. Calculate the amount of Current Assets and Current Liabilities.
Ans:
or, Current Assets = 3.5 Current Liabilities (1)
Working Capital = Current Assets - Current Liabilities
Working Capital = 90,000
or, Current Assets - Current Liabilities = 90,000
or, 3.5 Current Liabilities - Current Liabilities = 90,000 (from 1)
or, 2.5 Current Liabilities = 90,000
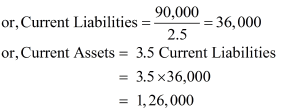
Q4: Shine Limited has a current ratio 4.5:1 and quick ratio 3:1; if the stock is 36,000, calculate current liabilities and current assets.
Ans:


or, 4.5 Current Liabilities = Current Assets


or, 3 Current Liabilities = Quick Assets
Quick Assets = Current Assets- Inventory = Current Assets - 36,000
Current Assets − Quick Assets = 36,000
or, 4.5 Current Liabilities − 3 Current Liabilities = 36,000
or, 1.5 Current Liabilities = 36,000
or, Current Liabilities = 24,000
Current Assets = 4.5 Current Liabilities
or, Current Assets = 4.5 x 24,000
= 1,08,000
Note: The solution given in the book is incorrect as it from the given figures Current Assets is ascertained to be Rs 1,08,000 and Current Liabilities Rs 24,000.
Q5: Current liabilities of a company are Rs 75,000. If current ratio is 4:1 and liquid ratio is 1:1, calculate value of current assets, liquid assets and inventory
Ans: Current Ratio = Current Assets /Current Liabilities
or, 4 = Current Assets / 75,000
or, 4 × 75,000 = Current Assets
or, Current Assets = 3,00,000
Liquid Ratio = Liquid Assets / Current Liabilities
or, 1 = Liquid Assets / 75,000
Liquid Assets = 75,000
Inventory = Current Assets − Liquid Assets
= 3,00,000 − 75,000
= 2,25,000
Q6: Handa Ltd. has stock of Rs. 20,000. Total liquid assets are Rs. 1,00,000 and quick ratio is 2:1. Calculate current ratio.
Ans: Quick Ratio = Quick Assets / Current Liabilities
or, 2 = 1,00,000 / Current Liabilities
or, Current Liabilities = 1,00,000 / 2
= 50,000
Current Assets = Liquid Assets + Inventory
= 1,00,000 + 20,000
= 1,20,000
Current Ratio = Current Assets / Current Liabilities
=1,20,000/ 50,000
=2.4/1= 2.4:1
Q7: Calculate debt equity ratio from the following information:

Ans:
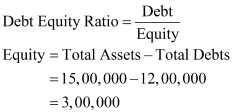
Long Term Depts = Total Depts - Current Liabilities

Q8: Calculate Current Ratio if:
Inventory is Rs 6,00,000; Liquid Assets Rs 24,00,000; Quick Ratio 2:1.
Ans:
Quick Assets = Quick Assets/Current Liabilities
2/1 = 2400000/Current Liabilities
Current Liabilities = 2400000/2 = 1200000
Current Assets = Liquid Assets + Inventory
= 2400000 + 600000 = 3000000
Current Ratio = Current Assets/Current Liabilities = 3000000/1200000 = 2.5:1
Q9: Compute Inventory Turnover Ratio from the following information:
 Ans:
Ans:
Inventory Turnover Ratio = Cost of Goods Sold/Average Inventory
= 150000/50000 = 3 times
Cost of Goods Sold = Net Sales – Gross Profit
= 200000 – 50000 = 150000
Inventory in the beginning = Inventory at the end – Excess of Inventory at the end over Inventory in the beginning
= 60000 – 20000 = 40000
Average Inventory = (Inventory in the beginning + Inventory at the end)/2
= (40000 + 60000)/2 = 100000/2 = 50000
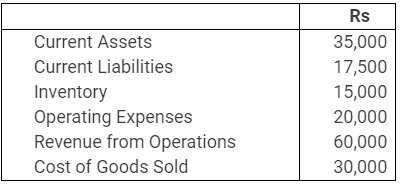
Q10: Calculate following ratios from the following information:
(i) Current ratio
(ii) Acid test ratio
(iii) Operating Ratio
(iv) Gross Profit Ratio
Ans:
(i) Current Ratio = Current Assets/Current Liabilities
= 35000/17500 = 2:1
(ii) Liquid Ratio = Liquid Assets/Current Liabilities
= 20000/17500 = 1.143:1
Liquid Assets = Current Assets – Inventory
= 35000 – 15000 = 20000
(iii) Operating Ratio = {(Cost of Goods Sold + Operating Expenses)/Net Revenue from Operations} x 100
= {(30000 + 20000)/60000} x 100 = {50000/60000} x 100 = 83.33%
(iv) Gross Profit Ratio = (Gross Profit/Net Revenue from Operations) x 100 = (30000/60000) x 100 = 50%
Gross Profit = Net Revenue from Operations – Cost of Goods Sold = 60000 – 30000 = 30000
Q11: From the following information, calculate:
(i) Gross Profit Ratio
(ii) Inventory Turnover Ratio
(iii) Current Ratio
(iv) Liquid Ratio
(v) Net Profit Ratio
(vi) Working capital Ratio: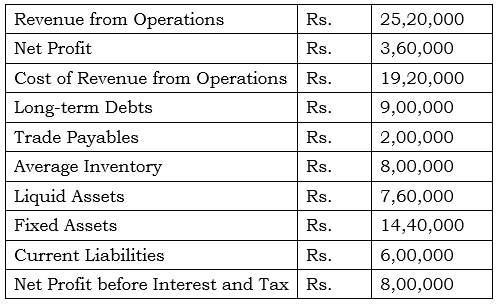
Ans:
(i) Gross Profit Ratio = (Gross Profit/Net Revenue from Operations) x 100
= (600000/2520000) x 100 = 23.81%
Gross Profit = Net Revenue from Operations – Cost of Revenue from Operations
= 2520000 – 1920000 = 600000
(ii) Inventory Turnover Ratio = Cost of Revenue from Operations/Average Inventory
= 1920000/800000 = 2.4 times
(iii) Current Ratio = Current Assets/Current Liabilities
= 1560000/600000 = 2.6:1
Current Assets = Liquid Assets + Inventory
= 760000 + 800000 = 1560000
(iv) Liquid Ratio = Liquid Assets/Current Liabilities
= 760000/600000 = 1.27:1
Note: The figure of Rs.760000 is taken as Liquid Assets and not the Current Assets.
(v) Net Profit Ratio = (Net Profit/Net Revenue from Operations) x 100
= (360000/2520000) x 100 = 14.28%
(vi) Working Capital Ratio = Revenue from Operations/Working Capital
= 2520000/960000 = 2.625 times
Working Capital = Current Assets – Current Liabilities
= 1560000 – 600000 = 960000
Q12: Compute Working Capital Turnover Ratio, Debt Equity Ratio and Proprietary Ratio from the following information:

Ans:
1. Working Capital Turnover Ratio = Revenue from Operations/Working Capital
= 1000000/120000 = 8.33 times
Working Capital = Current Assets – Current Liabilities
= 400000 – 280000 = 120000
2. Debt Equity Ratio = Debt/Equity
= 200000/500000 = 2:5 = 0.4:1
Total Assets = Paid-up Capital + Debentures + Current Liabilities (Since, Total Liabilities = Total Assets)
= 500000 + 200000 + 280000 = 980000
3. Proprietary Ratio = Shareholder Funds/Total Assets
= 500000/980000 = 0.51:1
Q13: Calculate Inventory Turnover Ratio if:
Inventory in the beginning is Rs 76,250, Inventory at the end is 98,500, Gross Revenue from Operations is Rs 5,20,000, Return Inwards is Rs 20,000, Purchases is Rs 3,22,250.
Ans:
Cost of Revenue from Operations = Inventory in the beginning + Purchase – Inventory at the end
= 76250 + 322250 – 98500 = 300000
Average Inventory = (Inventory in the beginning + Inventory at the end)/2
= (76250 + 98500)/2 = 174750/2 = 87375
Inventory Turnover Ratio = Cost of Revenue from Operations/Average Inventory
= 300000/87375 = 3.43 times
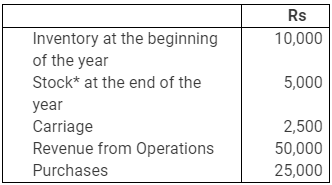
Q14: Calculate Inventory Turnover Ratio from the data given below:
Ans:
Cost of Revenue from Operations = Inventory in the beginning + Purchase + Carriage – Inventory at the end
= 10000 + 25000 + 2500 – 5000 = 32500
Average Inventory = (Inventory in the beginning + Inventory at the end)/2
= (10000 + 5000)/2 = 15000/2 = 7500
Inventory Turnover Ratio = Cost of Revenue from Operations/Average Inventory
= 32500/7500 = 4.33 times
Q15: A trading firm’s average inventory is Rs. 20,000 (cost). If the inventory turnover ratio is 8 times and the firm sells goods at a gross profit of 20% on sales, ascertain the gross profit of the firm.
Ans:
Inventory Turnover Ratio = Cost of Revenue from Operations/Average Inventory
8 = Cost of Revenue from Operations/20000
Cost of Revenue from Operations = 20000 x 8 = 160000
Let Sale Price be Rs.100
Then, Profit is Rs.20 Hence, the Cost of Revenue from Operations = 100 – 20 = Rs.80
If the Cost of Revenue from Operations is Rs.80, then Revenue from Operations = 100
If the Cost of Revenue from Operations is Re.1, then Revenue from Operations = 100/80
If the Cost of Revenue from Operations is Rs.160000, then Revenue from Operations = 100/80 x 160000 = 200000
Profit = Net Revenue from Operations – Cost of Revenue from Operations = 200000 – 160000 = 40000
Q16: You are able to collect the following information about a company for two years: Calculate Inventory Turnover Ratio and Trade Receivables Turnover Ratio
Ans:
Inventory Turnover Ratio = Cost of Revenue from Operations/Average Inventory
= 1800000/750000 = 2.4 times
Cost of Revenue from Operations = Revenue from Operations – Gross Profit
= 2400000 – 600000 = 1800000
Average Inventory = (Inventory in the beginning + Inventory at the end)/2
= (600000 + 900000)/2 = 1500000/2 = 750000
Average Trade Receivables = (Trade Receivables in the beginning + Trade Receivables at the end)/2
= (500000 + 560000)/2 = 530000
Trade Receivables Turnover Ratio = Net Credit Sales/Average Trade Receivables
= 2400000/530000 = 4.53 times
Q17: The following Balance Sheet and other information, calculate the following ratios:
(i) Debt-Equity Ratio
(ii) Working Capital Turnover Ratio
(iii) Trade Receivables Turnover Ratio
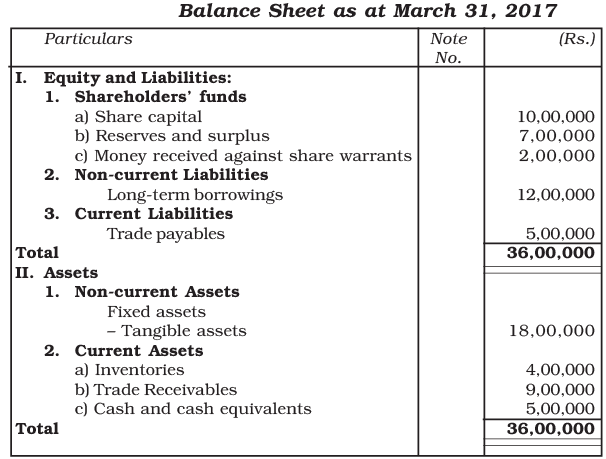 Additional Information: Revenue from Operations Rs. 18,00,000
Ans:
1. Debt-Equity Ratio
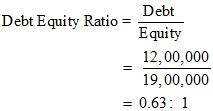
Debt = Long Term Borrowings = Rs 12,00,0000
Equity = Share Capital + Reserve and Surplus
= 10,00,000 + 9,00,000
= Rs 19,00,000
2. Working Capital Turnover Ratio = Revenue from Operations/Working Capital
= 1800000/1300000 = 1.39 times
Revenue from Operations = Rs 18, 00,000
Working Capital = Current Assets – Current Liabilities
= 18,00,000 – 5,00,000
= Rs 13,00,000
3. Trade Receivables Turnover Ratio = Net Credit Sales/Average Trade Receivables
=1800000/900000 = 2 times
Net Credit Sales = Rs 18,00,000
Average Trade Receivables = Rs 9,00,000
Q18: From the following information, calculate the following ratios:
(i) Liquid Ratio
(ii) Inventory turnover ratio
(iii) Return on investment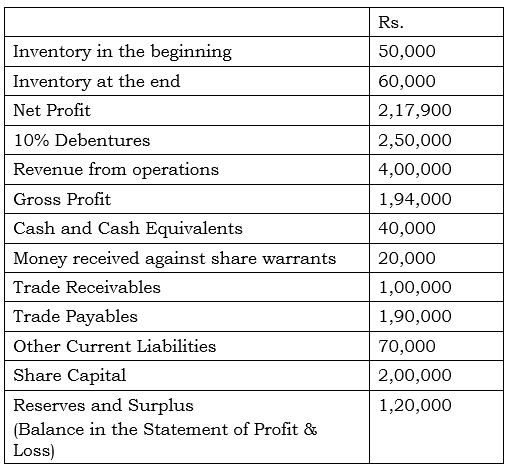 Ans:
Ans:
(i) Liquid Assets = Cash + Debtors
= 40000 + 100000 = 140000
Current Liabilities = Creditors + Outstanding Expenses
= 190000 + 70000 = 260000
Liquid Ratio = Liquid Assets/Current Liabilities
= 140000/260000 = 7:13 = 0.54:1
(ii) Cost of Revenue from Operations = Revenue from Operations – Gross Profit
= 400000 – 194000 = 206000
Average Inventory = (Inventory in the beginning + Inventory at the end)/2
= (50000 + 60000)/2 = 110000/2 = 55000
Inventory Turnover Ratio = Cost of Revenue from Operations/Average Inventory
= 206000/55000 = 3.74 times
(iii) Capital Employed = Equity Share Capital + Profit and Loss
= 200000 + 140000 = 340000
Return on Investment = (Profit before Interest and Tax/Capital Employed) x 100
= (140000/340000) x 100 = 41.17%
Q19: From the following, calculate
(a) Debt Equity Ratio
(b) Total Assets to Debt Ratio
(c) Proprietary Ratio.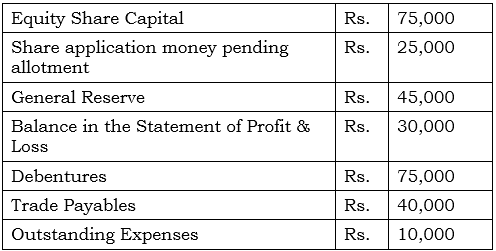
Ans:
(a) Debt-equity Ratio = Debt/Equity = 75000/175000 = 0.43:1
Debt = Debenture = 75000
Equity/Shareholders Fund = Equity Share Capital + Preference Share Capital + General Reserve + Accumulated Profits
= 75000 + 25000 + 45000 + 30000 = 175000
(b) Total Assets to Debt Ratio = Total Assets/Debt = 300000/75000 = 4:1
Total Assets = Equity Share Capital + Preference Share Capital + General Reserve + Accumulated Profits + Debentures + Sundry Creditors + Outstanding Expenses (Since Total Liabilities is equal to Total Assets)
= 75000 + 25000 + 45000 + 30000 + 75000 + 40000 + 10000 = 300000
(c) Proprietary Ratio = Shareholders Fund/Net Assets
= 175000/300000 = 0.58:1
Q20: Cost of Revenue from Operations is Rs. 1,50,000. Operating expenses are Rs. 60,000. Revenue from Operations is Rs. 2,50,000. Calculate Operating Ratio.
Ans:
Q21: Calculate the following ratio on the basis of following information:
(i) Gross Profit Ratio
(ii) Current Ratio
(iii) Acid Test Ratio
(iv) Inventory Turnover Ratio
(v) Fixed Assets Turnover Ratio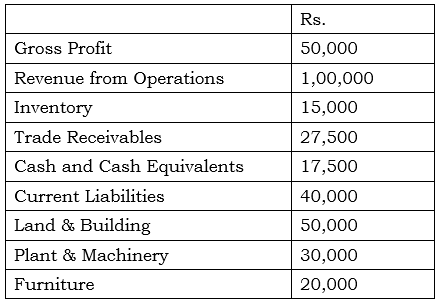 Ans:
Ans:
(i) Gross Profit Ratio = (Gross Profit/Revenue from Operations) x 100
= (50000/100000) x 100 = 50%
(ii) Current Ratio = Current Assets/Current Liabilities
= 60000/40000 = 1.5:1
Current Assets = Inventory + Trade Receivables + Cash and Cash Equivalents
= 15000 + 27500 + 17500 = 60000
(iii) Acid Test Ratio = Liquid Assets/Current Liabilities
= 45000/40000 = 1.125:1
Liquid Assets = Current Assets – Inventory
= 60000 – 15000 = 45000
(iv) Inventory Turnover Ratio = Cost of Revenue from Operations/Average Inventory = 50000/15000 = 3.33 times
Cost of Revenue from Operations = Revenue from Operations – Gross Profit = 100000 – 50000 = 50000 Average Inventory = 15000
Note: Since value of inventory in the beginning and inventory at the end is not given, the amount of inventory is assumed to be average inventory.
(v) Fixed Assets Turnover Ratio = Revenue from Operations/Net Fixed Assets
= 100000/100000 = 1:1
Net Fixed Assets = Land and Building + Plant and Machinery + Furniture
= 50000 + 30000 + 20000 = 100000
Q22: From the following information calculate Gross Profit Ratio, Inventory Turnover Ratio and Trade Receivable Turnover Ratio.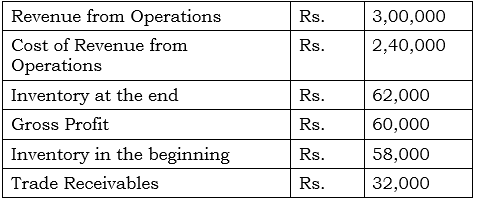 Ans:
Ans:
(i) Gross Profit Ratio = (Gross Profit/Net Revenue from Operations) x 100
= (60000/300000) x 100 = 20%
Gross Profit = Net Revenue from Operations – Cost of Revenue from Operations
= 300000 – 240000 = 60000
(ii) Inventory Turnover Ratio = Cost of Revenue from Operations/Average Inventory
= 240000/60000 = 4 times
Average Inventory = Inventory in the Beginning + Inventory at the end)/2
= (58000 + 62000)/2 = 120000/2 = 60000
(iii) Trade Receivables Turnover Ratio = Net Revenue from Operations/Average Trade Receivables
= 300000/32000 = 9.375 times
|
42 videos|199 docs|43 tests
|
FAQs on Accounting Ratios NCERT Solutions - Accountancy Class 12 - Commerce
| 1. What are accounting ratios and why are they important in financial analysis? |  |
| 2. What are the different types of accounting ratios? |  |
| 3. How do you calculate the current ratio, and what does it indicate? |  |
| 4. What is the significance of the debt-to-equity ratio in financial analysis? |  |
| 5. How can accounting ratios assist in comparing companies within the same industry? |  |


