NCERT Solutions: Smart Charts

1. Yamini did a project 'Animals and Birds'. She asked each child of her class about one favourite pet animal. She used tally marks to record each answer. For example if someone said cat she put one line in  front of cats. When someone said cat again, she added a line. So
  means two cats and
  means 5 cats. In all 24 children said cat was their favourite animal. Help Yamini complete the table.

(a) Look at the tally marks and write the number for each animal in the table. How many children in all did Yamini talk to?
Ans. First of all complete the table
- Cats: The tally marks are grouped in four sets of five and four additional marks, adding up to 24 (4 groups of 5 plus 4 additional marks = 20 + 4 = 24).
- Dogs: There are six complete groups of five tally marks, representing 30, plus two extra marks, adding up to 32.
- Rabbits: There are two complete groups of five and no additional marks, totalling 10.
- Cows: Four groups of five and two extra marks, totalling 22.
- Parrots: Only eight individual tally marks, no groups of five.
- Goats: Four groups of five, totalling 20.
- Squirrel: Three groups of five and no additional marks, totalling 15.

Yamini talked to 131 children in all.
(b) Which is the most favourite pet animal in this table?
Ans. In this table the most favourite pet animal is dog.
(c) Which pet will you like to have? What will you name it? Which other animals can be kept at home? Discuss.
Ans. The pet which I will take to have is dog. It will be named as Browny. The other animals which can be kept at home are horse, buffalo, pigeon, sparrow, duck, cock, hen, fish, turtle etc.
2. Making Tally Marks on the Road Sumita stood on the road for half an hour and counted the number of vehicles passing by. She made a tally mark for each vehicle. This helped her in counting quickly the total number of vehicles in each group.

(a)Write the number of each vehicle in the table.
Ans. (a)
Tally Marks:
- Single Tally Marks: Each single vertical tally mark represents one unit. For example, one car or one cycle.
- Grouping of Five: Once you reach four vertical tally marks, the fifth tally mark is drawn as a diagonal line across the first four, completing a group of five. This helps in making the count quicker and easier to read because each group of five is instantly recognizable.
How to Read and Fill the Tally Chart:
- Cycle: There are 5 complete groups of five tally marks (25) and three additional tally marks. Total = .
- Car: Two complete groups of five tally marks and two additional tally marks. Total = 12.
- Auto Rickshaw: Three complete groups of five tally marks and three additional tally marks. Total = 18.
- Bus: Three complete groups of five tally marks. Total = =15.
- Cycle Rickshaw: Four complete groups of five tally marks and four additional tally marks. Total = 24.
- Truck: One tally mark indicating there are 6 trucks (the 6th truck is not fully shown in the tally, Total = 6.

(b) How many vehicles in all did Sumita see on the road in half an hour?
Ans. Number of vehicles seen by Sumita in half an hour is 103.
(c) Auto Rickshaws are thrice the number of trucks - true/false?
Ans. False.
In the example of Sumita counting vehicles, the number of auto-rickshaws is not three times the number of trucks: Trucks: 6, Auto rickshaws: 18
(d) Make tally marks for 7 more buses, and 2 more trucks.
Ans.
Tally marks for 7 more buses: 
Tally marks for 2 more buses: 
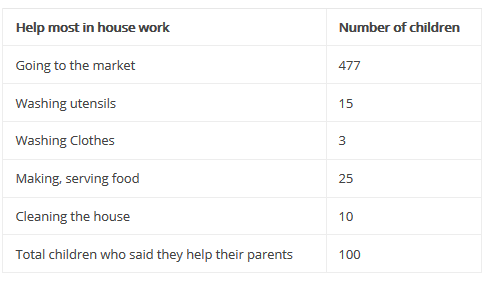
3. Helping Hands In the EVS period, the teacher asked children whether they help their parents at home. There were different answers. Children named the work in which they help their parents the most. The teacher collected their answers and made a table.

Ans.
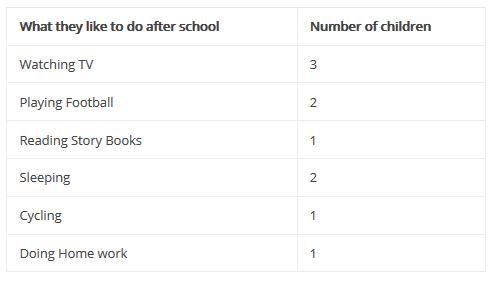
4. Ask 10 of your friends about what they like to do most after school.
Ans. On Collecting the answers given by my friends I tabulated information as under:
5. Ragini loves to watch cartoons on televisions. One day she thought for counting the number of ads during the breaks. She found that in each break there were 14 advertisements. In 10 of those ads there were children as actors.
(a) Why do you think that children are used in so many ads?
Ans. Children are used in so many advertisement as the cartoons are mostly watched by the children.
(b) Use tally marks to count the number of ads during a short break in a programme. Were there ads during the news programme?
Ans. Tally mark used to count the number of ads during a short break in a programme:

Yes, there were ads during the news programme.
6. Hot and Cold :
Have you seen the weather report on TV or in a newspaper? These are two bar charts. These show the highest temperature (in degrees Celsius) in four cities, on two different days. The cities are Delhi, Shimla, Bangalore and Jaisalmer.

Find out from the bar charts-
(a) Which city is the hottest on 1 June?
Ans. Jaisalmer is the hottest on 1 June.
(b) Which city is the coldest on 1 December?
Ans. Shimla is the coldest on 1 December.
(c) Which city shows little change in temperature on the two days- 1 June and 1 December?
Ans. Bangalore shows little change in temperature on the two days - 1 June and 1 December.
7. Rabbits in Australia:
Earlier there were no rabbits in Australia. Rabbits were brought to Australia around the year 1780. At that time there were no animals in Australia which ate rabbits. So the rabbits began to multiply at a very fast rate. Imagine what they did to the crops! The table shows how rabbits grew every year.

(a) After each year the number of rabbits was-
(1) a little less than double the number or rabbits in the last year.
(2) double the number in the last year.
(3) 8 more than the number of rabbits in the last year.
(4) more than double the number of rabbits in the last year.
Ans. (1) a little less than double the number or rabbits in the last year.
(b) At the end of year 6, the number of rabbits cross 1000?
(i) 400
(ii) 600
(iii) 800
Ans. (ii) 400.
(c) After which year did the number of rabbits cross 1000?
Ans. In the year 1788 (Year 8), the number of rabbits cross 1000.
8. Madhav's mother helped him understand his family with the help of this drawing . You can also find out about your older generations using such a family tree.
(a) How many grandparents in all does Shobhna have?
Ans. In all Shobhna has four grandparents.
(b) How many great great grandparents in all does Madhav have?
Ans. Madhav has 8 great, great grand parents.
(c) How many elders will be in the VII generation of his family?
Ans. There will be 32 elders in the VII generation of Madhav's family.
(d) If he takes his family tree forward in which generation will he find 128 elders?
Ans. 128 elders will be in IX generation of Madhav's family tree.
9. Find out the growth chart

(a) Between which days did the length of the plant change the most?
(i) 0-4 (ii) 4-8 (iii) 8-12 (iv) 12-16 (v) 16-20
Ans. (iii) 8-12
The plant grew the most between 8 and 12 days because it went from about 5 cm to 9 cm. This means it grew 4 cm during these days, which is more than in any other period on the graph.
(b) What could be the length of this plant on the 14 th day? Guess.
(i) 8.7cm
(ii) 9.9 cm
(iii)10.2 cm
(iv) 10.5 cm
Ans. (ii) 9.9 cm
Looking at the graph, the plant was around 9 cm tall on the 12th day and around 10 cm tall on the 16th day. So, halfway between these days, around the 14th day, it makes sense that the plant might be around 9.9 cm tall, almost 10 cm.
(c) Which plant keep growing all the time? What will be its length on the 100 th day? Make a guess.
Ans. Plants don't grow forever; they stop after reaching a certain size. By looking at how this plant's growth is slowing down on the graph, it probably won't grow much more after a while. By guessing, maybe by the 100th day, it could be around 16.4 cm if it grows a little more before it completely stops growing. This is just a guess and could change based on how the plant is taken care of and its natural limits.
FAQs on NCERT Solutions: Smart Charts
| 1. What are Smart Charts and how are they used in data representation? |  |
| 2. Why is it important to use Smart Charts in educational contexts? | |
| 3. How can students create their own Smart Charts effectively? | |
| 4. What are the common mistakes to avoid when using Smart Charts? | |
| 5. How can teachers incorporate Smart Charts into their lesson plans? | |


