Analysis of Financial Statements -2 NCERT Solutions | Accountancy Class 12 - Commerce PDF Download

Numerical Questions
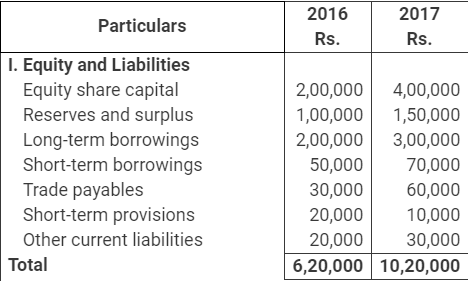
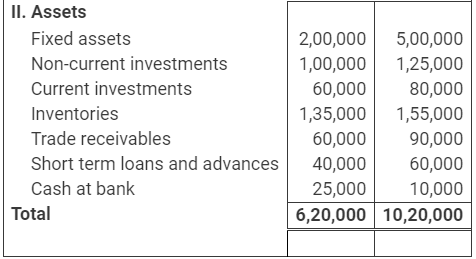
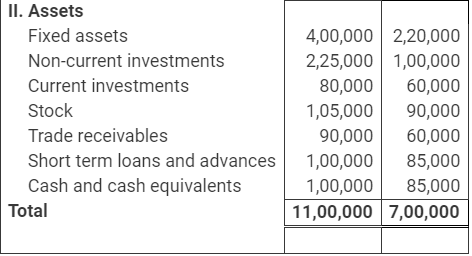
Q1: Following are the balance sheets of Alpha Ltd., as at March 31, 2016 and 2017.
You are required to prepare Comparative Balance Sheet.
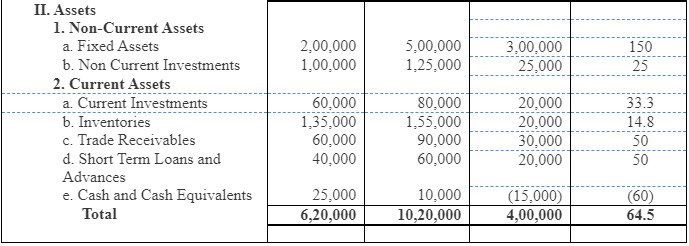
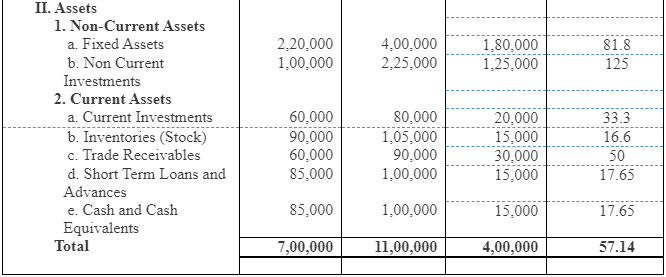
 Ans:
Ans: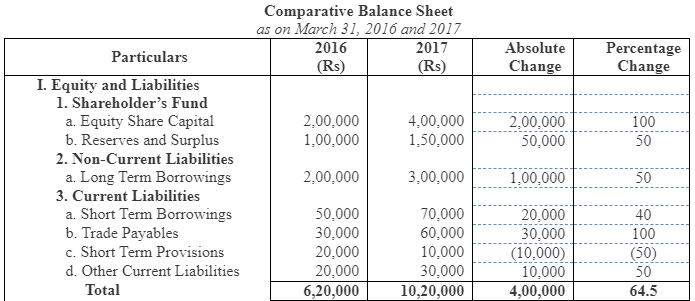
Q2: Following are the balance sheets of Beta Ltd. at March 31st, 2016 and 2017: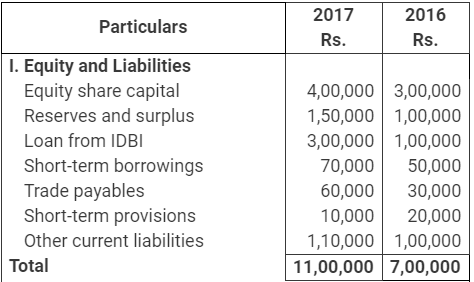
 Ans:
Ans: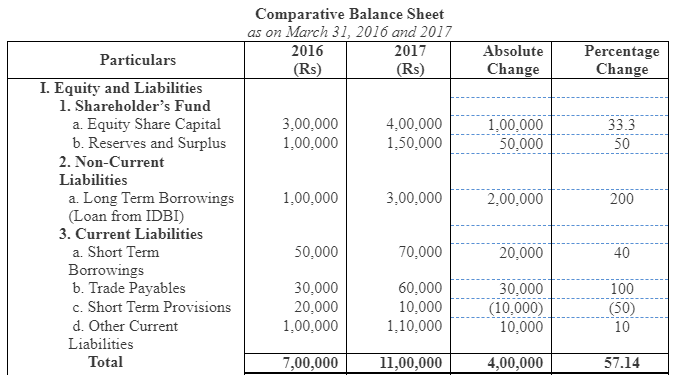
Q3: Prepare Comparative Statement of profit and loss from the following information.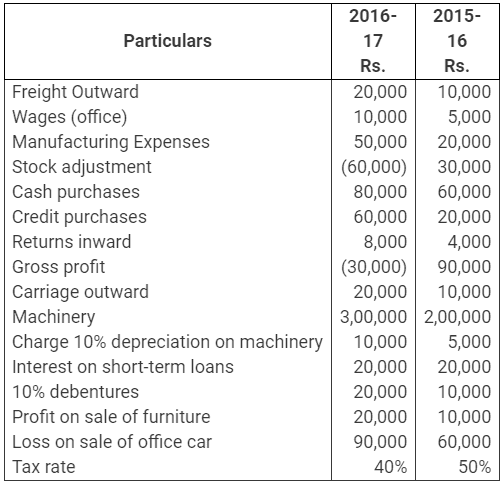 Ans:
Ans: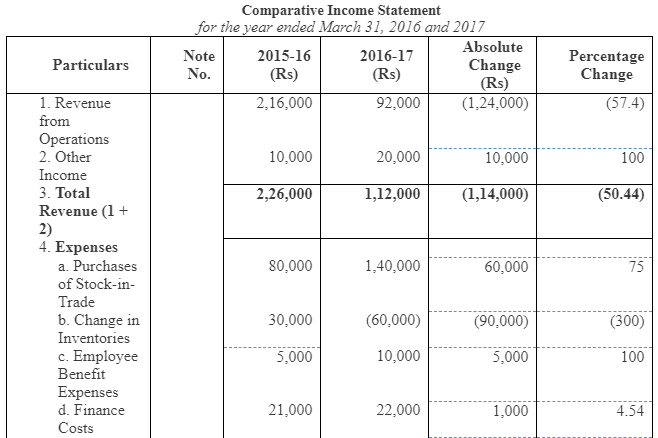
Working Notes:
1. Calculation of Net Sales
Net Sales = Cost of Goods Sold + Gross Profit - Sales Return
or, Net Sales = Purchases + Manufacturing Expenses + Change in Inventory + Gross Profit - Sales Return
Net Sales (2016) = 80,000 + 20,000 +30,000 + 90,000 - 4,000 = Rs 2,16,000
Net Sales (2017) = 1,40,000 + 50,000 - 60,000 - 30,000 - 80,000 = Rs 92,000
2. Calculation of Finance Cost
Finance Cost = Interest on short-term loans + Interest on 10% Debentures
Finance Cost (2016) = 20,000 + 1,000 = Rs 21,000
Finance Cost (2017) = 20,000 + 2,000 = Rs 22,000
3. Calculation of Other Expenses
Other Expenses = Freight Outward + Carriage Outward + Loss on sale of office car
Other Expenses (2016) = 10,000 + 10,000 + 60,000 = Rs. 80,000
Other Expenses (2017) = 20,000 + 20,000 + 90,000 = Rs. 1,30,000
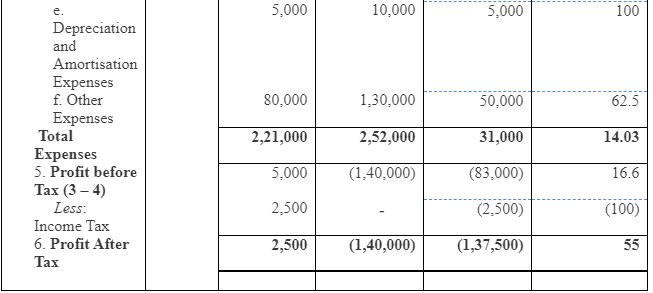
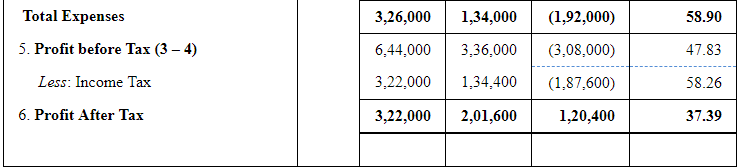
Q4: Prepare Comparative Statement of Profit and Loss from the following information: Ans:
Ans: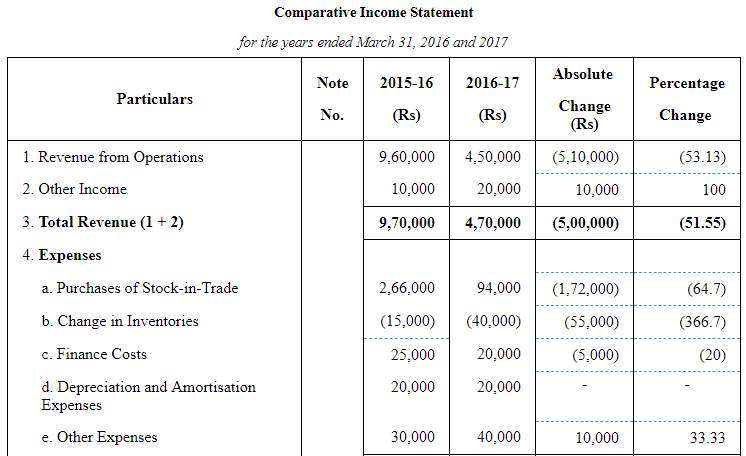
Working Notes:
1. Calculation of Net Purchases and Change in Inventory
2. Calculation of Finance Cost
Finance Cost = Interest on Bank Overdraft + Interest on Debentures
Finance Cost (2016) = 5,000 + 20,000 = Rs 25,000
Finance Cost (2017) = 0 + 20,000 = Rs 20,000
3. Calculation of Other Expenses
Other Expenses = Carriage outward + Other operating expenses
Other Expenses (2016) = 10,000 + 20,000 = Rs 30,000
Other Expenses (2017) = 30,000 + 10,000 = Rs 40,000
Q5: Prepare a Common size statement of profit and loss of Shefali Ltd. with the help of following information: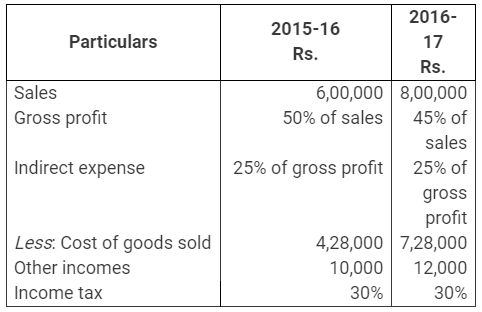 Ans:
Ans: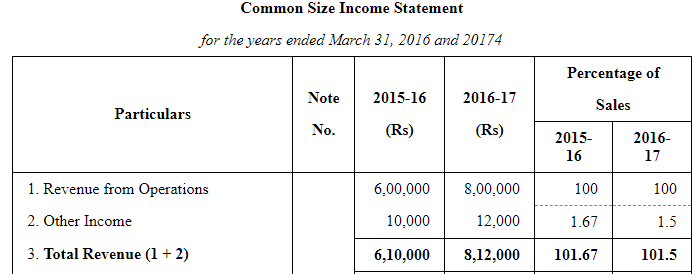
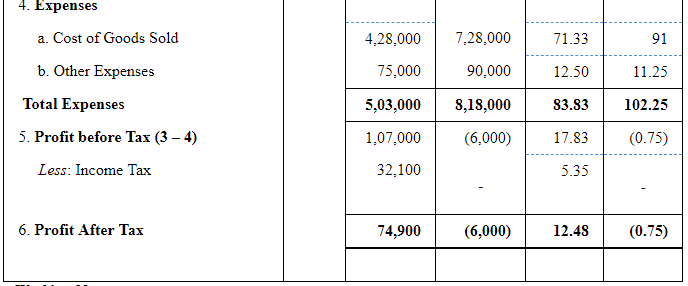 Working Notes:
1. Calculation of Other Expenses
Other Expenses = Indirect Expenses = % of Gross Profit
2016=6,00,000×50%×25%=Rs 75,000
2017=8,00,000×45%×25%=Rs 90,000
Q6: Prepare a Common Size balance sheet from the following balance sheet of Aditya Ltd., and Anjali Ltd.:
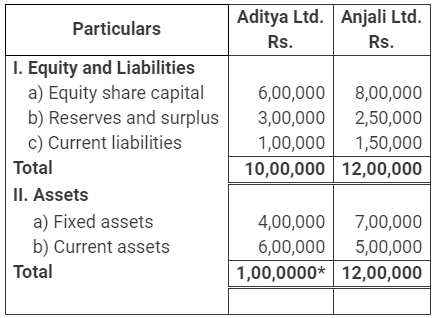 *The total of Liabilities side must be equal to the total of Assets side, therefore, it should be 10,00,000.
Ans: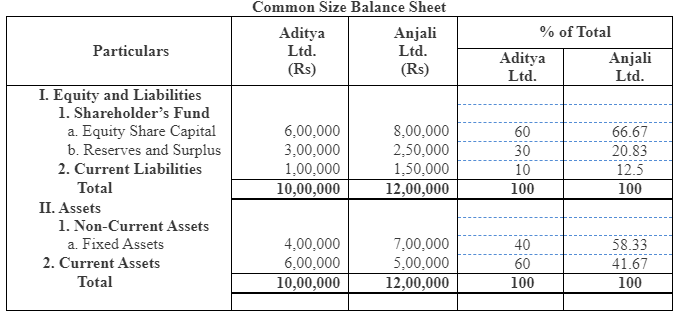
|
42 videos|199 docs|43 tests
|
FAQs on Analysis of Financial Statements -2 NCERT Solutions - Accountancy Class 12 - Commerce
| 1. What are the key components of financial statements? |  |
| 2. How do financial ratios help in analyzing financial statements? | |
| 3. What is the significance of the balance sheet in financial analysis? | |
| 4. How can cash flow analysis improve financial decision-making? | |
| 5. What are the limitations of financial statement analysis? | |


Analysis of Financial Statements -2 NCERT Solutions | Accountancy Class 12 - Commerce
,Objective type Questions
,past year papers
,Analysis of Financial Statements -2 NCERT Solutions | Accountancy Class 12 - Commerce
,Previous Year Questions with Solutions
,Exam
,ppt
,Viva Questions
,Sample Paper
,video lectures
,Important questions
,practice quizzes
,MCQs
,shortcuts and tricks
,study material
,Summary
,Analysis of Financial Statements -2 NCERT Solutions | Accountancy Class 12 - Commerce
,mock tests for examination
,Free
,Semester Notes
,Extra Questions
;


NCERT Solutions: Analysis of Financial Statements -2 Free PDF Download
Importance of NCERT Solutions: Analysis of Financial Statements -2
NCERT Solutions: Analysis of Financial Statements -2 Notes
NCERT Solutions: Analysis of Financial Statements -2 Commerce Questions
Study NCERT Solutions: Analysis of Financial Statements -2 on the App
|
© EduRev
|
Education Revolution
|


|


within 7 days!