NCERT Solutions: Poverty as a Challenge

 Q1. How is the poverty line estimated in India?
Ans: In India, the poverty line is estimated by calculating the income or consumption required to meet basic needs such as food, clothing and shelter. The method converts basic food requirements into a calorie norm and then estimates the cost of a standard basket of goods needed to meet that calorie requirement and other essential non-food items. The main steps are:
- Determine calorie requirements per person per day: Rural areas - 2400 calories; Urban areas - 2100 calories.
- Fix a standard basket of food items that supplies these calories and estimate its cost using prevailing prices.
- Add an allowance for non-food items (clothing, fuel, housing) to obtain the full subsistence cost.
- Express this cost as a per person per month figure; adjust for inflation and changes in prices over time.
Using this method, the poverty line for 2011-12 was set at Rs 816 per person per month in rural areas and Rs 1,000 per person per month in urban areas. The estimate is updated periodically using large sample surveys conducted by the National Sample Survey Office (NSSO).
Q2. Do you think that the present methodology of poverty estimation is appropriate?
Ans: The present methodology focuses mainly on a minimum subsistence level measured by income or consumption. While it shows who cannot afford basic needs, it has important limitations and may not be fully appropriate on its own.
- It measures only monetary deprivation (income/consumption) and misses non-monetary aspects such as education, health and access to services.
- It sets a narrow threshold that identifies only subsistence poverty, not whether people enjoy a reasonable standard of living or opportunities to improve their lives.
- Price differences across regions and changes in consumption patterns can make direct comparisons difficult.
- Some basic needs (for example, access to clean water, sanitation, secure housing, or social inclusion) are hard to capture purely by income figures.
Many experts therefore prefer broader measures, such as the multidimensional poverty approach, which includes indicators like education, health and living standards. In short, the current method is useful for tracking extreme monetary deprivation but should be complemented by multidimensional indicators to give a fuller picture of poverty.
Q3. Describe poverty trends in India since 1973?
Ans: India has experienced a substantial decline in poverty since 1973, though the pace and extent of reduction vary across periods and states.
- National headcount rates fell from about 55% in 1973 to 36% in 1993 and further to 22% in 2011-12.
- All states have shown declines in poverty since the early 1970s, but some states achieved faster reductions than others.
- According to the Multidimensional Poverty Index for 2019-21, the national poverty rate was about 15%, reflecting improvements in non-monetary deprivations as well.
- States such as Kerala, Gujarat, Punjab and Jammu & Kashmir have shown notable improvements; Karnataka, Tamil Nadu and Delhi had headcount ratios below 10% in 2019-21.
- Large states with higher initial poverty, such as Bihar and Uttar Pradesh, have also made progress but continue to face challenges.
Overall, while poverty has fallen markedly over the decades, regional differences persist and sustained economic growth combined with investments in human development remain important to reduce poverty further.
Q4. Discuss the major reasons for poverty in India?
Ans: Major reasons for poverty in India include:
- Colonial rule: Long periods of colonial policies weakened traditional industries, restricted Indian industrial growth and left the economy with low levels of capital and infrastructure.
- Low economic growth and high population growth: Slow growth in the past and rapid population growth reduced gains per person, making it harder to raise incomes and living standards.
- Rural poverty: Benefits from agricultural development and rural programmes were uneven, landlessness and small holdings persisted, and many rural workers remained in low-paid casual jobs.
- Urban poverty: Industrial and urban growth did not create enough formal jobs, so many migrants and city dwellers work in the informal sector as vendors, construction workers, domestic workers or casual labourers with low and insecure incomes.
These factors, together with social inequalities, limited access to education and health services, and regional disparities, have contributed to persistent poverty in the country.
Q5. Identify the social and economic groups which are most vulnerable to poverty in India.
Ans: The social groups most vulnerable to poverty are:
- Households belonging to Scheduled Castes (SCs)
- Households belonging to Scheduled Tribes (STs)
The economic groups most at risk include:
- Rural agricultural labour households (many have little or no land and depend on casual farm work)
- Urban casual labour households (workers in informal, low-paid and insecure jobs)
These groups face lower access to land, education, formal jobs and public services, which increases their vulnerability to poverty.
Q6. Give an account of interstate disparities of poverty in India.
Ans: Poverty levels differ considerably across Indian states. Key points are:
- The national Head Count Ratio (HCR) was about 22% in 2011-12, but state figures varied widely.
- By 2019-21, states such as Bihar, Jharkhand and Uttar Pradesh continued to show relatively high multidimensional poverty.
- Conversely, states like Kerala, Maharashtra and Tamil Nadu have achieved larger reductions in poverty, helped by better public services, higher agricultural growth and investments in human capital.
- States such as Punjab and Haryana reduced poverty mainly through higher agricultural productivity and rural incomes.
Thus, differences in economic growth, agricultural performance, public services and social policies explain much of the interstate variation in poverty.
Q7. Describe global poverty trends.
Ans: Global poverty trends show uneven progress across regions:
- East Asia, led by China, and parts of South-East Asia achieved rapid reductions in poverty through fast economic growth and investments in health and education.
- In Latin America, poverty rates have been relatively stable, with some countries making progress at different times.
- In Sub-Saharan Africa, poverty fell only slightly from about 36.6% in 2017 to 35% in 2019, meaning the region still has a high burden of extreme poverty.
- Poverty also emerged or re-appeared in some former socialist countries such as Russia after economic transitions.
Overall, global poverty has declined significantly over recent decades, but progress is uneven and certain regions still face large challenges.
Q8. Describe the role of government in reducing poverty in India?
 MNREGA
- Prime Minister's Rozgar Yojana (PMRY) (launched 1993): Provides assistance and credit to educated unemployed youth to set up small enterprises and generate self-employment in small towns and rural areas.
- Pradhan Mantri Gramodaya Yojana (PMGY) (from 2000): Focuses on improving basic rural services such as primary health, elementary education, rural housing, drinking water and electrification.
- Rural Employment Generation Programme (REGP) (started 1995): Aimed at creating employment through support for small productive units and self-employment projects in rural and urban areas.
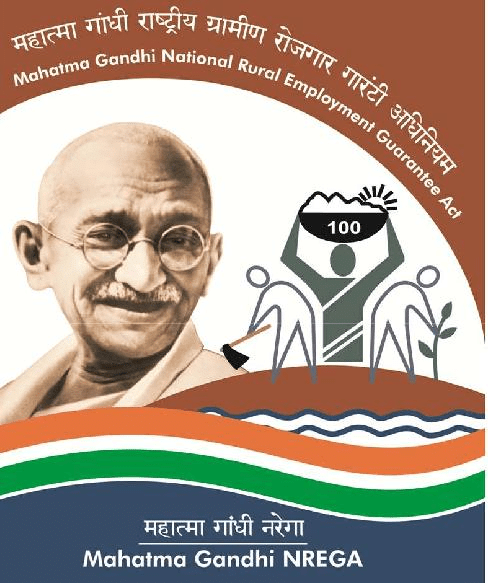
- Mahatma Gandhi National Rural Employment Guarantee Act (MGNREGA) (enacted 2005): Guarantees up to 100 days of wage employment per rural household in designated districts, emphasises durable assets and natural resource management, and reserves one-third of jobs for women.
These programmes aim to create employment, raise incomes, provide basic services and build rural infrastructure. Together with broader policies for economic growth, they form the government's strategy to reduce poverty.
Q9. What do you understand by human poverty?
Ans: Human poverty means deprivation that goes beyond the lack of money. It is the denial of basic opportunities that allow people to live with dignity and participate in society. Key dimensions include:
- Illiteracy and lack of educational opportunities
- Lack of gainful employment or job security
- Inadequate access to healthcare and sanitation
- Discrimination based on caste, gender or other social factors
Human poverty highlights multiple deprivations that reduce a person's ability to lead a healthy, secure and productive life.
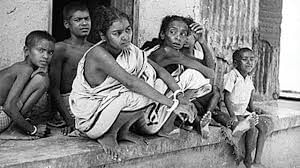
Q10: Who are the poorest of the poor?
Ans: The poorest of the poor are those who suffer the highest levels of deprivation within poor families.
These groups include:
• Women, who often receive less food, healthcare and opportunities
• Children, who face malnutrition and lack of schooling
• Elderly people, who have no earning capacity and limited support
In many poor households, these members suffer more than others because they are the most dependent and have the least access to family resources.
Q11: What are the main features of the Mahatma Gandhi National Rural Employment Guarantee Act 2005?
Ans: The major features of the Mahatma Gandhi National Rural Employment Guarantee Act (MGNREGA), 2005 are:
• It guarantees 100 days of wage employment in a year to every rural household that demands work.
• One-third of the jobs are reserved for women, ensuring their participation in paid employment.
• If employment is not provided within 15 days of application, the applicant is entitled to an unemployment allowance.
• The Act emphasises sustainable development, including water conservation, drought proofing, and creation of durable community assets.
These provisions aim to provide livelihood security to rural families and strengthen the natural resource base of rural areas.
Q12: Differentiate between consumption-based poverty line and NMP Index-based poverty estimates.
Ans: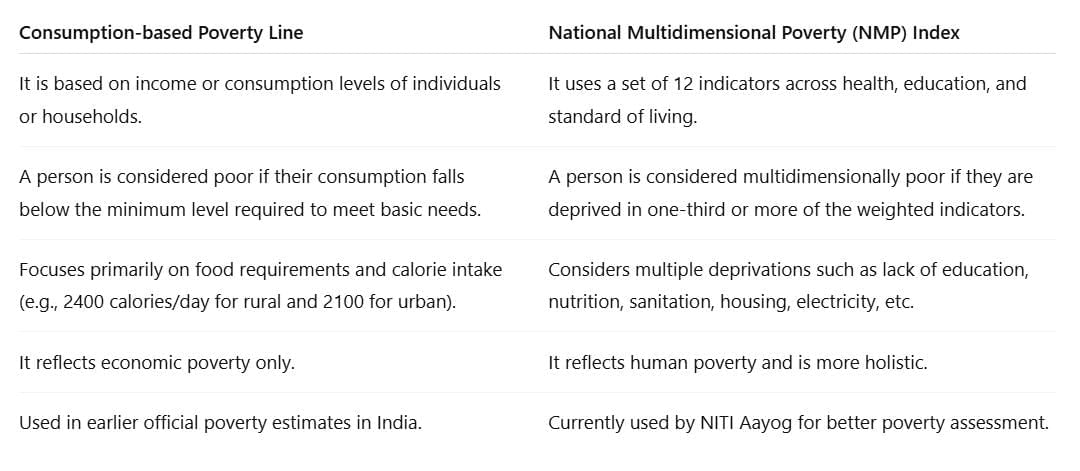
Q13: List the indicators used to estimate multidimensional poor in India.
Ans: The National Multidimensional Poverty Index (NMP Index) developed by NITI Aayog uses the following 12 indicators grouped under health, education and standard of living:
- Nutrition: Households are deprived if any child (0-59 months), woman (15-49 years) or man (15-54 years) is undernourished.
- Child-Adolescent Mortality: Deprivation if a child or adolescent under 18 has died in the household during the last five years.
- Maternal Health: Deprivation if any woman gave birth in the last five years without skilled medical assistance.
- Years of Schooling: Deprivation if no member aged 10 or older has completed six years of schooling.
- School Attendance: Deprivation if any school-aged child is not attending school.
- Cooking Fuel: Deprivation if the household uses biomass such as wood, dung or coal for cooking.
- Sanitation: Deprivation if the household lacks improved sanitation or shares a facility with others.
- Drinking Water: Deprivation if the household lacks access to safe drinking water or if the source is more than 30 minutes away.
- Housing: Deprivation if the dwelling is constructed with natural or rudimentary materials and is inadequate.
- Electricity: Deprivation if the household has no access to electricity.
- Assets: Deprivation if the household does not own more than one essential asset and lacks a vehicle such as a car or truck.
- Bank Account: Deprivation if no member has a bank or post office account.
FAQs on NCERT Solutions: Poverty as a Challenge
| 1. What are the main causes of poverty in India according to CBSE Class 9 Social Studies? |  |
| 2. How is absolute poverty different from relative poverty in the context of this chapter? | |
| 3. What percentage of India's population lives below the poverty line as per NCERT Class 9 data? | |
| 4. What role do government anti-poverty programmes play in addressing poverty as a challenge? | |
| 5. Why is education considered a key strategy for reducing poverty in developing economies like India? | |


