NCERT Solutions: Sectors of the Indian Economy

Page 23
Q1. What does the history of developed countries indicate about the shifts that have taken place between sectors?
Ans. The history of developed countries shows that economies typically shift from the primary sector (agriculture) to the secondary sector (manufacturing) and eventually to the tertiary sector (services). Initially, agriculture dominates, then as farming efficiency improves, workers move to industry, and later, as income rises, the service sector becomes the largest in both production and employment.
Q2. Correct and arrange the important aspects for calculating GDP from this Jumble.
To count goods and services we add the numbers that are produced. We count all those that were produced in the last five years. Since we shouldn't leave out anything we add up all these goods and services.
Ans.
- To calculate GDP, we count only the final goods and services produced within a country in a given year. This means goods meant for immediate use by consumers, businesses or the government are included for that specific year.
- We do not add intermediate goods to avoid double counting. Including intermediate goods (goods used to make other goods) would count the same value more than once.
- We do not simply count quantities (like number of cars). Instead, we use the monetary value of final goods and services, because monetary values allow aggregation across different products and services.
Q3. Discuss with your teacher how you could calculate the total value of a good or service by using the method of value added at each stage.
Ans. To calculate the total value of a good or service using the value-added method, follow these steps:
Identify Steps: Break the production process into stages (for example: raw material supplier → processor → manufacturer → retailer).
Find Value Added: At each stage, subtract the cost of inputs bought from other firms from the value of the output sold. This difference is the value added at that stage.
Add Up Values: Sum the value added at all stages to get the total value of the final product. This total equals the market value of the final good and avoids double counting.
For example, wheat sold to a mill, the miller's output (flour) sold to a baker, and the baker's output (bread) sold in the market: add the miller's value added and the baker's value added to obtain the total value of the bread.
Page 27
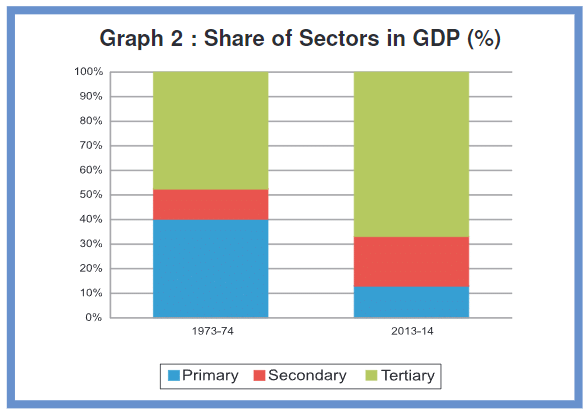
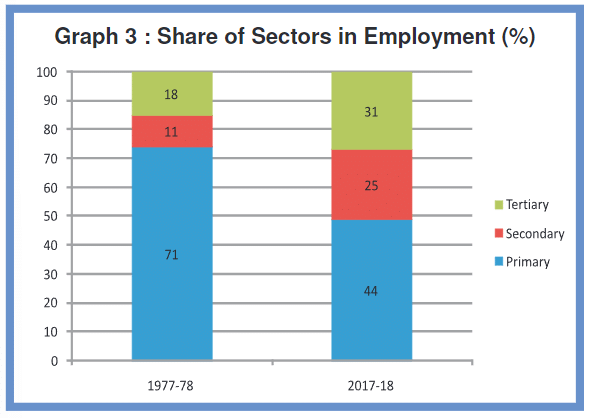
Q1. Complete the table using the data given in Graphs 2 and 3 and answer the question that follows. Ignore if data are not available for some years.
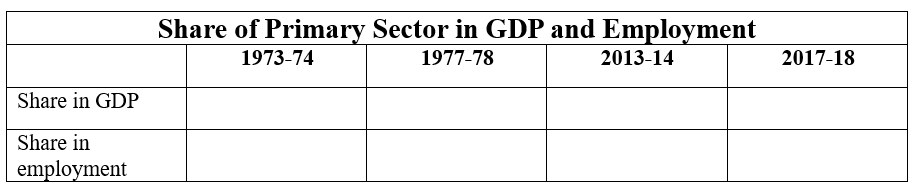
What are the changes that you observe in the primary sector over a span of forty years?
Ans.
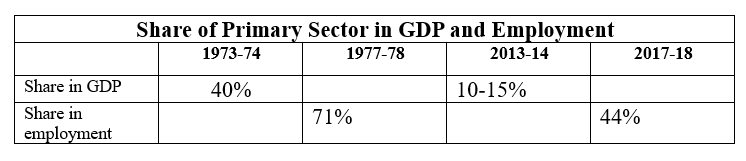
The share of the primary sector in GDP has fallen markedly over the forty-year span from about 40% in 1973-74 to roughly 10-15% in 2013-14. At the same time, the share of employment in the primary sector has also decreased, though less sharply from about 71% to around 44%. These changes reflect higher agricultural productivity, mechanisation and technological improvement in farming (so fewer workers produce the same or more output), and faster growth in the secondary and tertiary sectors which have absorbed more of the country's output. However, employment shifted away from agriculture more slowly than output did, which is why a large share of workers still remain in the primary sector despite its lower GDP share.
Q2. Choose the correct answer: Underemployment occurs when people
(i) do not want to work
(ii) are working in a lazy manner
(iii) are working less than what they are capable of doing
(iv) are not paid for their work
Ans.
Ans: (iii) are working less than what they are capable of doing
Explanation: Underemployment refers to situations where people have work but it does not fully use their skills, time or capacity. For example, a trained farmer or skilled worker doing only a few hours of low-productivity work because there are no better opportunities is underemployed. It is different from not wanting to work or from not being paid.
Q3. Compare and contrast the changes in India with the pattern that was observed for developed countries. What kind of changes between sectors were desired but did not happen in India?
Ans.
- Developed countries followed a clear pattern: a large share of workers moved from primary to secondary and then to tertiary sectors as incomes and productivity rose.
- In India, the tertiary sector has grown rapidly in GDP share, but employment did not move out of agriculture at the same speed.
- A large portion of India's workforce remains in agriculture (primary sector) even though this sector contributes a much smaller share of GDP.
- The expected large-scale shift of workers into manufacturing (secondary sector) - which would have provided many regular, higher-productivity jobs - did not happen to the extent desired.
- As a result, many people remain in low-productivity agricultural work or informal service jobs, leading to underemployment and low incomes.
Q4. Why should we be worried about underemployment?
Ans.
- Underemployment means many people are doing less work than they could, so the economy is not using its human resources efficiently.
- This leads to low incomes and persistent poverty for a large number of families.
- Because too many people are employed in low-productivity jobs (often in agriculture), overall productivity and per capita income remain low.
- Underemployment also masks unemployment - people may appear employed but are not earning enough or fully utilising their skills.
- To improve living standards, it is crucial to create better, higher-productivity jobs in manufacturing and services.
Page 29
Q1. Why do you think MGNREGA 2005 is referred to as ' Right to work' ?
Ans. MGNREGA 2005 is called the 'Right to Work' because it gives every adult in rural areas a legal entitlement to get up to 100 days of guaranteed employment in a year, on demand. If the government fails to provide this work within a specified time, it must pay unemployment allowance. Thus, the Act makes access to work a legally enforceable right rather than a mere welfare measure.
Q2. Imagine that you are the village head. In that capacity suggest some activities that you think should be taken up under this Act that would also increase the income of people? Discuss.
Ans. As the village head, I would recommend the following MGNREGA activities because they raise productivity and incomes:
- Water Conservation: Build ponds, check dams and recharge wells to improve irrigation. Better water availability increases crop yields and allows for additional crops.
- Land Development: Land levelling and soil conservation improve the area under cultivation and productivity.
- Roads: Construct rural access roads to connect farms to markets, reducing transport costs and spoilage.
- Afforestation and Horticulture: Planting fruit trees and community orchards provides long-term income and employment.
- Livestock and Fisheries: Construct shelters, troughs and fish ponds to support animal husbandry and fish farming, which diversify incomes.
Q3. How would income and employment increase if farmers were provided with irrigation and marketing facilities?
Ans. Providing irrigation and marketing facilities leads to higher income and employment by:
- Increasing Crop Yields: Reliable irrigation raises production per hectare.
- Allowing Crop Diversification: Farmers can grow higher-value and multiple crops, improving income.
- Reducing Risk: With irrigation, crop failures due to drought fall, stabilising earnings.
- Reducing Post-Harvest Losses: Better marketing infrastructure (storage, cold chains) cuts spoilage and improves prices received.
- Generating Jobs: Building and operating irrigation systems, storage facilities and market services creates local employment.
Q4. In what ways can employment be increased in urban areas?
Ans. Employment in urban areas can be increased through:
- Promoting Service Industries: Growth in healthcare, education, retail, hospitality and IT generates many jobs.
- Supporting Small and Medium Enterprises (SMEs): Easier credit, business training and infrastructure help start and expand local firms.
- Investing in Infrastructure Projects: Urban transport, housing and utilities create direct construction jobs and long-term service jobs.
- Boosting Retail and Tourism: Better city facilities and attractions increase demand for services and shopkeepers.
- Providing Skill Training: Vocational training and apprenticeships match workers to industry needs and improve employability.
Page 31
Q1. Look at the following examples. Which of these are unorganised sector activities?
(i) A teacher taking classes in a school
(ii) A headload worker carrying a bag of cement on his back in a market
(iii) A farmer irrigating her field (iv) A doctor in a hospital treating a patient
(v) A daily wage labourer working under a contractor
(vi) A factory worker going to work in a big factory
(vii) A handloom weaver working in her house
Ans. (i), (iii), (v) and (vii) are examples of activities in the unorganised sector.
Q2. Talk to someone who has a regular job in the organised sector and another who works in the unorganised sector. Compare and contrast their working conditions in all aspects.
Ans. Organised Sector:
- Job Security: Generally secure with written employment contracts.
- Wages: Regular and fixed monthly or salaried payments.
- Benefits: Health insurance, provident fund, paid leave and retirement benefits are common.
- Working Hours: Fixed and regulated.
- Work Environment: Often safer and subject to labour regulations.
- Legal Protections: Access to grievance redressal and labour laws.
Unorganised Sector:
- Job Security: Often insecure and temporary.
- Wages: Irregular, daily or piece-rate payments.
- Benefits: Usually none-no insurance or retirement benefits.
- Working Hours: Unpredictable and sometimes long.
- Work Environment: Less regulated and may be unsafe.
- Legal Protections: Limited access to formal labour protections.
Q3. How would you distinguish between organised and unorganised sectors? Explain in your own words
Ans.
The organised sector consists of enterprises with formal structures and clear rules. Workers usually have written contracts, fixed wages and benefits. The sector follows labour laws and regulations.
The unorganised sector consists of informal or small-scale activities where work is not officially registered. Workers usually lack job security, have irregular wages and receive no benefits. Examples include small shopkeepers, casual labourers and home-based artisans.
Q4. The table below shows the estimated number of workers in India in the organised and unorganised sectors. Read the table carefully. Fill in the missing data and answer the questions that follow.
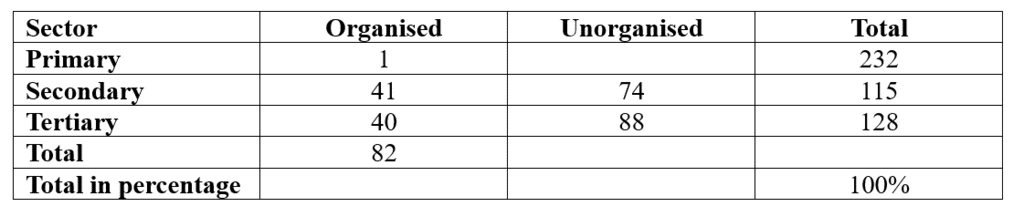
(a) What is the percentage of people in the unorganised sector in agriculture?
(b) Do you agree that agriculture is an unorganised sector activity? Why?
(c) If we look at the country as a whole, we find that ---% of the workers in India are in the unorganised sector. Organised sector employment is available to only about ---% of the workers in India.
Ans.
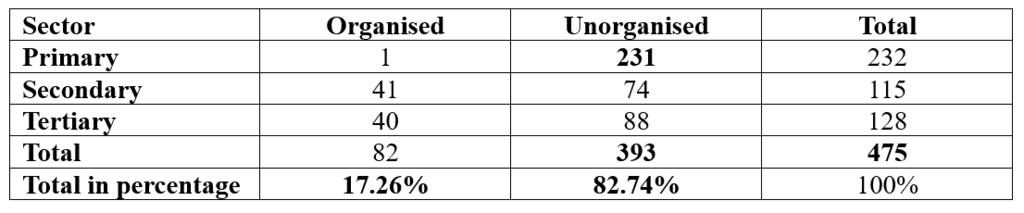
(a) The percentage of people in the unorganised sector is 82.74%.
(b) Yes. Agriculture is largely an unorganised sector activity because:
- No formal contracts or guaranteed job security for many agricultural workers.
- Irregular incomes due to seasonality and dependence on weather.
- No fixed working hours; work varies with crop cycles.
- No social benefits like pensions or health insurance for most workers.
- Low regulation compared with organised industries.
(c) If we look at the country as a whole, we find that 82.74% of the workers in India are in the unorganised sector. Organised sector employment is available to only about 17.26% of the workers in India.
Page 35
Q1. Fill in the blanks using the correct option given in the bracket
(a) Employment in the service sector _________ increased to the same extent as production. (has / has not)
(b) Workers in the _________ sector do not produce goods. (tertiary / agricultural)
(c) Most of the workers in the _________ sector enjoy job security. (organised / unorganised)
(d) A _________ proportion of labourers in India are working in the unorganised sector. (large / small)
(e) Cotton is a _________ product and cloth is a _________ product. (natural / manufactured)
(f) The activities in primary, secondary and tertiary sectors are _________. (independent / interdependent)
Ans:
(a) Employment in the service sector has not increased to the same extent as production
(b) Workers in the tertiary sector do not produce goods.
(c) Most of the workers in the organised sector enjoy job security.
(d) A large proportion of labourers in India are working in the unorganised sector.
(e) Cotton is a natural product and cloth is a manufactured product.
(f) The activities in primary, secondary, and tertiary sectors are interdependent.
Q2. Choose the most appropriate answer.
(a) The sectors are classified into public and private sector on the basis of
(i) employment conditions.
(ii) the nature of economic activity.
(iii) ownership of enterprises.
(iv) number of workers employed in the enterprise.
Ans: (iii) ownership of enterprises
Explanation: The main distinction between public and private sectors is who owns and controls the enterprise. Public sector enterprises are government-owned, while private sector enterprises are owned by individuals or private firms.
(b) Production of a commodity, mostly through the natural process, is an activity in ______________ sector.
(i) primary
(ii) secondary
(iii) tertiary
(iv) information technology
Ans: (i) primary
Explanation: The primary sector includes activities that extract or produce goods directly from nature, such as agriculture, forestry, fishing and mining.
(c) GDP is the total value of _____________ produced during a particular year.
(i) all goods and services
(ii) all final goods and services
(iii) all intermediate goods and services
(iv) all intermediate and final goods and services
Ans: (ii) all final goods and services
Explanation: GDP counts the monetary value of all final goods and services produced within a country in a year. Intermediate goods are excluded to avoid double counting.
(d) In terms of GDP the share of tertiary sector in 2013-14 is _________ per cent.
(i) 20 to 30
(ii) 30 to 40
(iii) 50 to 60
(iv) 60 to 70
Ans: (iii) 50 to 60
Explanation: By 2013-14 the tertiary sector accounted for around half or more of the country's GDP, reflecting the growing importance of services.

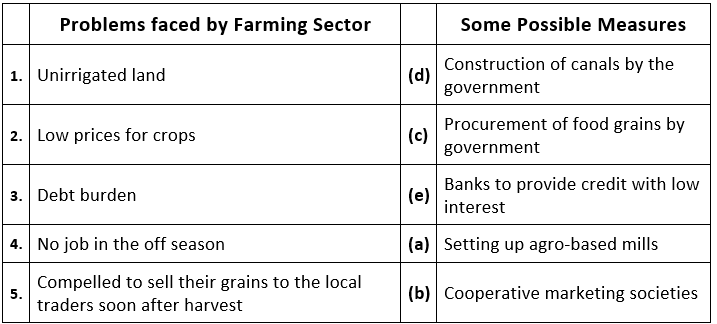
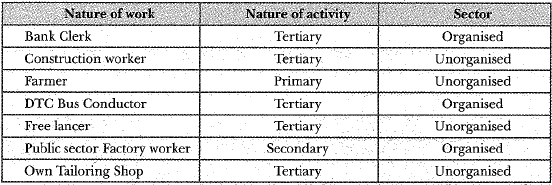
Q3. Match the following
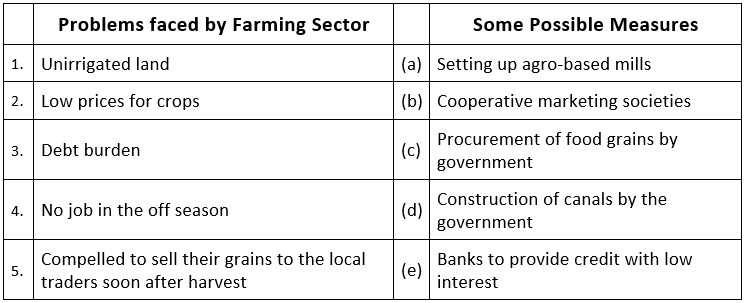
Ans:
Q4. Find the odd one out and say why.
(i) Tourist guide, dhobi, tailor, potter
(ii) Teacher, doctor, vegetable vendor, lawyer
(iii) Postman, cobbler, soldier, police constable
(iv) MTNL, Indian Railways, Air India, Jet Airways, All India Radio
Ans:
(i) Tourist Guide
He is often appointed or licensed by government tourism departments, while dhobi, tailor and potter typically work privately.
(ii) Vegetable Vendor
The vegetable vendor primarily performs a primary sector function (selling farm produce), whereas teacher, doctor and lawyer provide tertiary (service) sector activities.
(iii) Cobbler
The rest (postman, soldier, police constable) are public servants or organised sector workers; the cobbler typically works in the private or informal sector.
(iv) Jet Airways
Jet Airways is a private enterprise, while the others listed are government-owned enterprises.
Q5. A research scholar looked at the working people in the city of Surat and found the following.
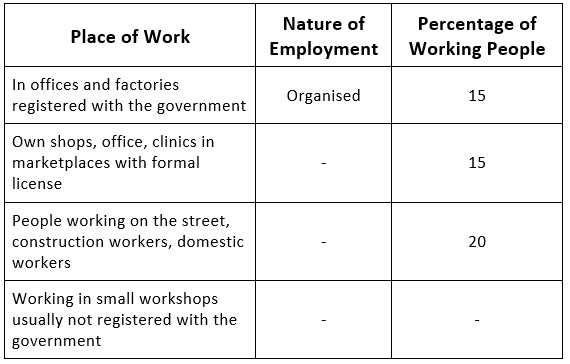
Complete the table. What is the percentage of workers in the unorganised sector in this city?
Ans:
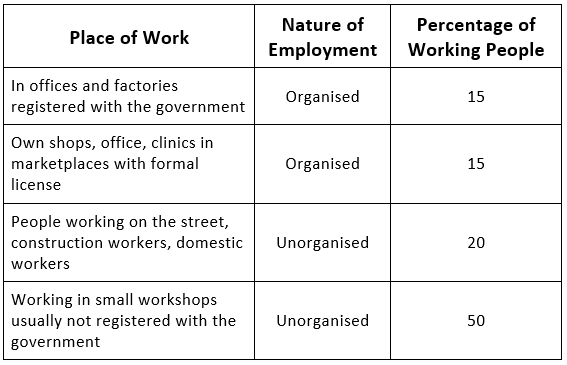
The percentage of workers in the unorganised sector in this city is 70% (50% + 20%).
Q6. Do you think the classification of economic activities into primary, secondary, and tertiary is useful? Explain how.
Ans:
- Yes, classifying activities into primary, secondary and tertiary helps us understand how people are employed and where value is created in the economy.
- It shows which sectors contribute more to the country's GDP and to employment, helping policymakers target interventions.
- This classification is useful for planning, for example in designing training programmes, investment priorities and social policies.
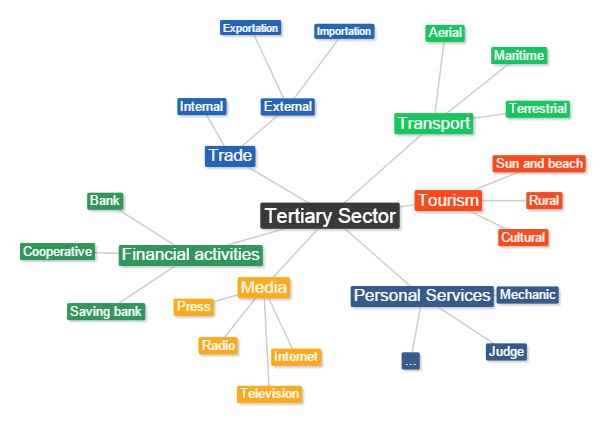
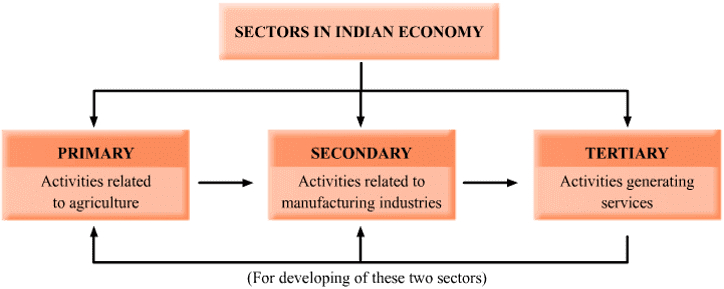 Classification of Economic Sectors
 - It is necessary to classify activities for effective economic administration and development planning.
Q7. For each of the sectors that we came across in this chapter, why should one focus on employment and GDP? Could there be other issues which should be examined? Discuss.
Ans:
- Employment and GDP are important because they indicate how many people are working and how much value each sector produces.
- Together they help estimate per capita income and sectoral productivity.
- Analysing both shows whether economic growth is creating sufficient and good quality jobs.
- Other issues to examine include literacy, poverty, nutrition and basic health care - these affect people's ability to work and benefit from growth.
Q8. Make a long list of all kinds of work that you find adults around you doing for a living. In what way can you classify them? Explain your choice.
Ans:
We can classify work by the nature of activity (primary, secondary, tertiary) and by employment conditions (organised, unorganised). This helps to organise information and to plan policies targeted at each category.
Q9. How is the tertiary sector different from other sectors? Illustrate with a few examples.
Ans:
- The tertiary sector provides services rather than producing physical goods.
- It supports the primary and secondary sectors through activities such as transport, storage, banking and communications.
- Examples include teachers, doctors, bankers, transport operators, and IT professionals.
Q10. What do you understand by disguised unemployment? Explain with an example each from the urban and rural areas.
Ans:
- Disguised unemployment occurs when more people are employed than needed for a given job; removing some workers would not reduce output.
- Rural example: Several members of a family work on a small farm even though only a few are actually needed; the extra hands do not increase total production.
- Urban example: Multiple family members doing occasional odd jobs or piece-rate work without steady hours - they are 'employed' but do not get regular, full work.

Q11. Distinguish between open unemployment and disguised unemployment.
Ans:
- Open unemployment means a person has no job and is not earning at all.
- Disguised unemployment means people appear employed but their work is redundant or less than their capacity; removing some of them would not reduce total output.
Q12. "Tertiary sector is not playing any significant role in the development of Indian economy." Do you agree? Give reasons in support of your answer.
Ans: No, this statement is not true. Over the past four decades (1970-2010), the tertiary sector has become the largest producer. This growth in the service sector is due to several factors:
- Demand for essential services like healthcare, education, security, and finance.
- Emergence of new services like IT.
- Growth of primary and secondary sectors.
- Increased demand for services driven by rising per capita income.
- The GDP share of the tertiary sector has grown from around 40% in 1973-74 to more than 50% in 2013-14.
Q13. Service sector in India employs two different kinds of people. Who are these?
Ans:
(i) Skilled and educated workers: Employed in IT, banking, large public and private enterprises; they usually earn higher wages and contribute substantially to national income.
(ii) Low-skilled and less educated workers: Employed in informal service jobs such as painters, plumbers, repairpersons and street vendors; they often work in the unorganised sector with irregular incomes.
Q14 Workers are exploited in the unorganised sector. Do you agree with this view? Give reasons in support of your answer.
Ans:
- Yes. Workers in the unorganised sector are often exploited because they lack job security, formal contracts and social benefits.
- They have little bargaining power to demand fair wages or safe working conditions, and there is limited scope for unions or legal enforcement.
- Examples include daily wage labourers who get paid below minimum wage, and informal workers with no sick leave or insurance.
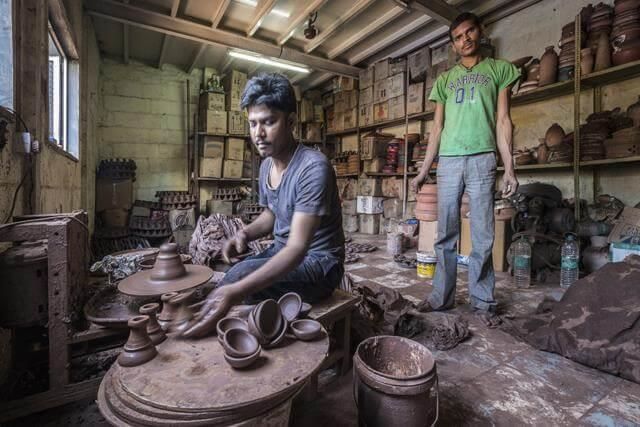 Unorganised Sector
- Because of these conditions, unorganised workers are vulnerable to economic shocks and health risks.
Q15. How are the activities in the economy classified on the basis of employment conditions?
Ans: They are mainly classified in two types:
(i) Organised Sector
- The organised sector includes enterprises where terms of employment are regular and workers have job security.
- These enterprises follow labour laws such as the Factories Act, Minimum Wages Act, Payment of Gratuity Act and shops and establishments laws.
- Workers in this sector have fixed working hours and benefits like paid leave, provident fund and medical support.
(ii) Unorganised Sector
- These are enterprises not registered with the government and which do not follow formal employment rules.
- There are no fixed terms of employment or job security.
- Workers do not receive regular benefits such as pensions or health insurance.
Q16. Compare the employment conditions prevailing in the organised and unorganised sectors.
Ans:
- The organised sector offers job security, fixed wages, paid holidays, pensions, health benefits and regulated working hours.
- The unorganised sector typically provides no job security, irregular wages, no social benefits, uncertain hours and often unsafe working conditions.
Q17 Explain the objective of implementing the MG NREGA 2005.
Ans: The objectives of implementing MGNREGA 2005 are:
- To increase employment and income for rural households by guaranteeing work.
- To create durable assets (like water conservation and land development) that improve rural productivity.
- To provide a legal right to work in targeted districts and ensure social protection through employment.
- To provide up to 100 days of work per household, and if this is not provided, to give unemployment allowances as compensation.
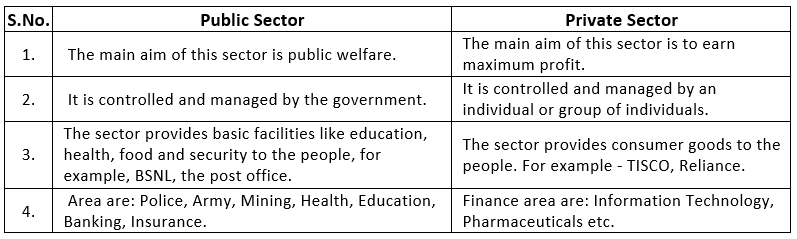
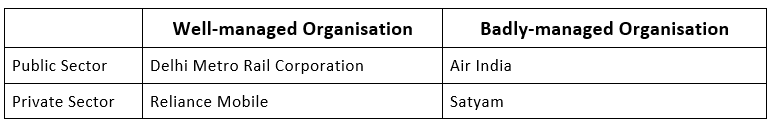
Q18. Using examples from your area compare and contrast the activities and functions of private and public sectors.
Ans:
Q19. Discuss and fill the following table giving one example each from your area.
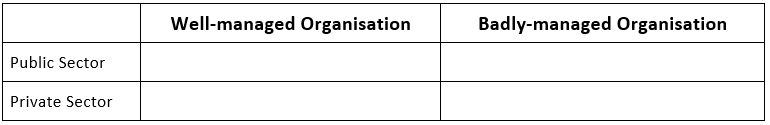
Ans:
Q20. Give a few examples of public sector activities and explain why the government has taken them up.
Ans:
- AIIMS: The government set up AIIMS to provide high-quality healthcare and medical education at reasonable cost.
- Railways: Railways require very large investment and long planning; government ownership ensures affordable mass transport and nationwide connectivity.
- Electric Power Generation by NTPC: The government invested in power generation to ensure reliable electricity supply at reasonable tariffs for consumers and industry.
Q21. Explain how public sector contributes to the economic development of a nation.
Ans:
- The public sector supports human development by providing public goods and services such as education and health, which raise the Human Development Index.
- By procuring food grains at fair prices and providing utilities like electricity and water at subsidised rates, the government helps secure livelihoods and food security.
- Public investments in infrastructure and social services create conditions for private investment and higher productivity, contributing to economic development.
Q22. The workers in the unorganised sector need protection on the following issues: wages, safety and health. Explain with examples.
Ans: The workers in the unorganised sector need protection on wages, safety, and health:
- Wages: Wages and working hours are irregular. For example, construction labourers are often paid daily and may receive less than the minimum wage. A stricter implementation of the Minimum Wages Act would protect them from exploitation.
- Safety: Many unorganised workers lack safety gear. For example, miners or informal factory workers may work without proper protective equipment, risking accidents and long-term illness. Better enforcement of safety rules is needed.
- Health: Unorganised workers usually do not get health insurance or sick leave. Workers exposed to hazardous processes may face chronic health problems without support. Government schemes or employer contributions can provide some protection.
Q23. A study in Ahmedabad found that out of 15,00,000 workers in the city, 11,00,000 worked in the unorganised sector. The total income of the city in this year (1997-1998) was ₹60,000 million. Out of this ₹32,000 million was generated in the organised sector. Present this data as a table. What kind of ways should be thought of for generating more employment in the city?
Ans:
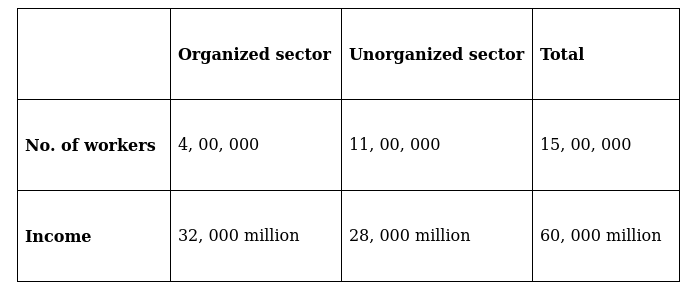
- Though most workers (11,00,000) were in the unorganised sector, a large share of income (₹32,000 million of ₹60,000 million) came from the organised sector, showing higher per-worker earnings there.
- To generate more employment and raise incomes, the government should encourage small firms to formalise, provide incentives for new industries, invest in skills training and improve urban infrastructure to attract investment.
Q24. The following table gives the GDP in Rupees (Crores) by the three sectors:
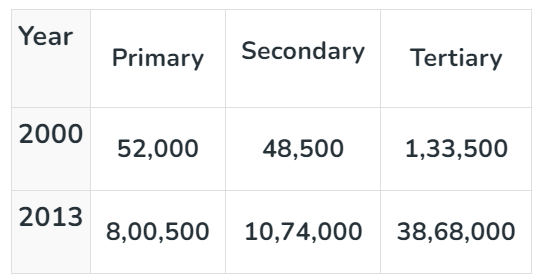
(i) Calculate the share of the three sectors in GDP for 2000 and 2013.
(ii) Show the data as a bar diagram similar to Graph 2 in the chapter.
(iii) What conclusions can we draw from the bar graph?
Ans:
(i) In 2000
Primary sector = 22.22%
Secondary sector = 20.73%
Tertiary sector = 57.04%
In 2013
Primary sector = 13.94%
Secondary sector = 18.70%
Tertiary sector = 67.36%
(ii)
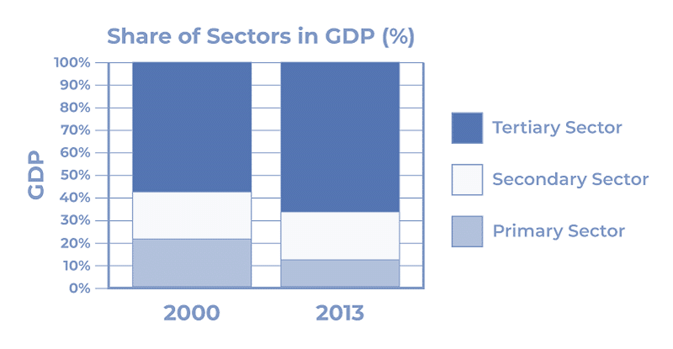
(iii) From the bar graph we conclude that over the period the tertiary sector's share in GDP increased substantially (by around 10 percentage points), the primary sector's share declined by almost half, and the secondary sector showed modest growth. This indicates a shift towards a service-led economy and a reduced relative importance of agriculture in national output.
FAQs on NCERT Solutions: Sectors of the Indian Economy
| 1. What's the difference between primary, secondary, and tertiary sectors in the Indian economy? |  |
| 2. Why is agriculture still so important in India even though we're becoming more industrialised? | |
| 3. How has India's economic structure changed from the colonial period to now in terms of sector contribution? | |
| 4. What are some examples of secondary sector activities that students should know for their CBSE exams? | |
| 5. Why do some economists say India needs to strengthen its secondary sector despite growth in services? | |


