Hydrographs

Hydrographs
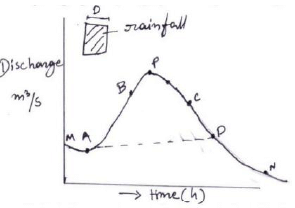
Hydrograph is the graphical representation of the variation of flow (discharge) in a stream with time at a specific location, produced in response to a given rainfall input over the catchment. A hydrograph of direct runoff (DRH) isolates the streamflow component produced directly by a storm after deducting base flow and other delayed contributions.
Components of a hydrograph
- Base flow recession - the slow declining portion of the hydrograph due to groundwater contributions (labelled MA and DN in the diagram).
- Rising limb - the section where discharge increases rapidly after the start of effective rainfall (labelled AB).
- Crest segment - the portion around the peak discharge (labelled BC).
- Falling limb - the portion where discharge decreases after the peak (labelled CD).
- Peak discharge - the maximum ordinate on the hydrograph corresponding to the highest flow produced by the storm.
- Lag time - the time between the centre (or peak) of the rainfall hyetograph and the peak of the hydrograph.
Unit hydrograph
Definition
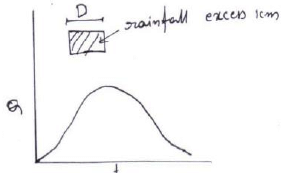
Unit hydrograph is defined as the hydrograph of direct runoff resulting from 1 unit depth (for example, 1 cm) of effective rainfall (rainfall excess) occurring uniformly over the basin and at a uniform rate for a specified duration D (D-hour). A unit hydrograph derived for a duration D is called a D-hour unit hydrograph.
Basic assumptions of unit hydrograph theory
- Time invariance - the direct runoff response to a given effective rainfall is assumed to be the same irrespective of when the rainfall occurs; the DRH for a given ER remains identical for different storm occurrences.
- Linear response - the response is assumed linear so that the principle of superposition applies: if input x1(t) produces output y1(t) and input x2(t) produces output y2(t), then input x1(t) + x2(t) produces y1(t) + y2(t).
Application of the unit hydrograph
Given a D-hour unit hydrograph and a storm hyetograph, the usual procedure to obtain the direct runoff hydrograph (DRH) is:
- Estimate and deduct initial and infiltration losses from the storm hyetograph to obtain the effective rainfall hyetograph (ERH).
- Divide the ERH into blocks of duration D (number of blocks M may be determined by storm length).
- Operate each D-hour block of rainfall excess on the D-hour unit hydrograph to produce corresponding DRH ordinates (scale the unit hydrograph by the depth of each block).
- Time-shift (lag) the DRHs of successive blocks appropriately so they are placed at correct time intervals.
- Sum the ordinates at each time to obtain the net DRH due to the entire storm.
Derivation and transformation of unit hydrographs
Method of superposition
If a D-hour unit hydrograph is available and a unit hydrograph of duration nD (n an integer) is required, superposition can be used. n copies of the D-hour unit hydrograph are placed successively, each displaced by D hours. The sum of these n unit hydrographs gives the hydrograph produced by n cm of uniform effective rainfall of duration nD. Division of the summed hydrograph ordinates by n yields the nD-hour unit hydrograph.
S-curve (S-hydrograph) technique
The S-curve is formed by summing an infinite series of D-hour unit hydrographs spaced D hours apart. It represents the hydrograph produced by a continuous effective rainfall at a constant rate extending for an indefinite time. The S-curve reaches an equilibrium discharge after a time approximately equal to the base of the first unit hydrograph. The average intensity of effective rainfall producing the S-curve is 1/D cm per hour.
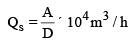
Where A = area of catchment in km2, D = duration in hours of effective rainfall for the unit hydrograph.
Derivation of a T-hour unit hydrograph from S-curves
Consider two S-curves produced by the same D-hour unit hydrograph but displaced by T hours; call them A and B. The ordinate differences (SA - SB) produce the direct runoff hydrograph due to a continuous effective rainfall of duration T hours and magnitude D·T cm. If the ordinate differences are divided by D·T the resulting ordinates correspond to a unit hydrograph of duration T hours (a T-hour unit hydrograph).

Probability and frequency concepts
Basic probability
If the probability of occurrence of an event is p, the probability of non-occurrence is q = 1 - p.
The probability that the event occurs r times in n independent trials (for example r years out of n years) is given by the binomial formula:
pr,n = nCr · pr · qn-r
The probability that the event does not occur at all in n successive trials is:
P0,n = qn
The probability that the event occurs at least once in n successive trials is:
P1 = 1 - qn
Probable Maximum Precipitation (PMP)
Probable Maximum Precipitation is defined as the greatest depth of precipitation for a given duration that is meteorologically possible for a particular location or basin. PMP is used in extreme flood studies and for design of major hydraulic structures where maximum credible precipitation must be considered.

In empirical or empirical-statistical methods a precipitation factor (K) may be used in regional equations; K represents a multiplier or adjustment based on catchment and storm characteristics.
Evapotranspiration, evaporation and transpiration
Evapotranspiration is the combined process of evaporation from water bodies and soil surfaces together with transpiration from vegetation; it represents the total water vapour flux from the land surface to the atmosphere.
Evaporimeters (or evaporation pans) are instruments used to estimate evaporation under field conditions.
Common types of evaporimeters
- Class A evaporation pan - a standard open pan used widely for pan evaporation measurements.
- ISI standard pan - another standard geometry used in some regions and by standards organisations.
Lake or open water evaporation is often estimated from pan evaporation by using a pan coefficient Cp. The typical relation is:
Lake evaporation = Cp × pan evaporation
Transpiration is the process by which water is lost from plant leaves to the atmosphere as water vapour.
Measurement of evapotranspiration
- Lysimeter - a device that measures actual evapotranspiration by recording changes in mass (or water balance) of a column of soil with vegetation.
- Pan evaporation measurements and empirical or theoretical equations (for example Penman equation) are used to estimate potential or reference evapotranspiration.
Penman's equation provides an estimate of potential evapotranspiration (PET) combining energy balance and aerodynamic terms. The general form is provided in the image below; variables are explained after the formula.

Where:
- PET = daily potential evapotranspiration (mm/day)
- A = slope of the saturation vapour pressure vs temperature curve (mm of vapour per °C or appropriate units)
- Hn = net radiation expressed as equivalent depth of evaporable water per day (mm/day)
- Ea = aerodynamic term depending on wind speed and vapour pressure deficit
- g = psychrometric constant (a constant depending on atmospheric pressure and specific heat)
Isopleths
Isopleth (or contour) lines on maps join locations having equal values of a particular meteorological or hydrological variable, for example equal rainfall depth (isohyets), equal evaporation, or equal evapotranspiration. Isopleth maps help visualise spatial patterns of rainfall, evaporation and other field variables.
Infiltration and infiltration capacity
Infiltration is the flow of water from the ground surface into the soil. Infiltration capacity is the maximum rate at which the soil can absorb water at any time under given conditions.
Horton's equation for infiltration capacity
Horton observed that infiltration capacity decreases with time from an initial maximum to a final steady value and proposed an exponential decay form:
f = fc + (fo - fc) e-k t
Where:
- f = infiltration capacity at time t (depth/time)
- fo = initial infiltration capacity at t = 0
- fc = final (constant) infiltration capacity after long time
- k = decay constant depending on soil and surface conditions
- t = time from start of rainfall
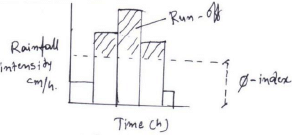
φ-index (phi-index)
The φ-index is the constant rate of infiltration/abstraction during the storm period such that total rainfall volume in the storm minus the total abstraction volume equals the measured runoff volume. It is commonly used in simple rainfall-runoff analysis where a single average loss rate is assumed.
A relation quoted for a 24-hour storm is:
φ-Index = (I - R) / 24
Where:
- I = total rainfall depth (cm) in 24 hours
- R = total runoff depth (cm) resulting from that 24-hour rainfall
W-index
The W-index is another index used to represent average abstracting capacity or loss conditions during a storm. It relates storm precipitation, runoff and initial losses. The illustrative variables are shown with the image below.

Where:
- P = total storm precipitation
- R = total runoff produced by the storm
- Ia = initial losses (for example interception, depression storage)
- te = duration of rainfall excess
Streamflow measurement methods
Common methods to measure or estimate streamflow (discharge) include:
- Area-velocity method - Q = A × V, where Q is discharge, A is cross-sectional area and V is mean velocity. Velocity is measured using current meters or other velocity sensors; the cross-section is surveyed.
- Dilution technique - a tracer (chemical or dye) is introduced and its concentration downstream is measured to compute discharge from mass balance.
- Ultrasonic (acoustic) method - uses acoustic Doppler or ultrasonic sensors to measure water velocity and often depth, enabling discharge estimation.
- Indirect methods - stage-discharge relationships (rating curves) developed from observed stages and corresponding measured discharges.
- Hydraulic structures - flow over weirs, through flumes or orifices where empirical or theoretical relations relate depth to discharge.
- Slope-area method - an energy equation based method for open channel flow where cross-section, slope and roughness are used to estimate discharge (often used for natural channels without measurements).
Note on practice: Selection of a measurement method depends on accuracy requirements, channel conditions, availability of instruments, stage variability and operational considerations. For long-term hydrological studies, development of reliable stage-discharge rating curves is common practice.
FAQs on Hydrographs
| 1. What is a hydrograph in civil engineering? |  |
| 2. How is a hydrograph useful in civil engineering projects? | |
| 3. What are the components of a hydrograph? | |
| 4. How is a hydrograph created and analyzed? | |
| 5. What are the applications of hydrographs in civil engineering? | |