Corona

Introduction
Corona is a self-sustained electric discharge in which the field-intensified ionisation is localised only over a portion of the distance between conductors. It is a phenomenon of ionisation of the air surrounding a high-voltage conductor and is normally seen near sharp edges or irregularities on the conductor surface.
- Corona is characterised by a faint glow, audible crackling and hissing, and the production of ozone (O3) due to conversion of atmospheric oxygen.
- Corona occurs when the electric field at the conductor surface is sufficient to ionise air molecules locally but not enough to cause complete breakdown between conductors.
Critical Disruptive Voltage
The critical disruptive voltage is the voltage at which complete dielectric disruption (breakdown) of the air gap occurs between conductors. It corresponds to the condition when the electric field at the conductor surface becomes equal to the breakdown strength of air.
- For smooth conductors in air at normal temperature and pressure (NTP: 25°C and 76 cm of Hg), corona begins when the peak value of the electric field intensity reaches about 30 kV/cm.
- The onset of corona depends on the air density (which varies with temperature and barometric pressure) and on the surface condition (roughness) of the conductor.

- The critical field intensity is directly proportional to the density of air.
- Surface roughness or sharp projections on a conductor distort the local electric field and produce local regions of high potential gradient, thereby lowering the critical intensity required for corona onset.
- The RMS value of the critical intensity after accounting for temperature, pressure and surface condition is given by an expression involving an irregularity/roughness factor.
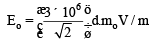
In the expression above, mo denotes the roughness factor of the conductor surface.
- The roughness factor is approximately 1.00 for a smooth conductor and typically in the range 0.93-0.98 for rough surfaces exposed to atmosphere.
- Critical disruptive voltage for a single-phase line is given by the standard relation involving conductor radius and spacing.
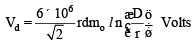
In this formula, r is the radius of the conductor and D is the spacing between conductors.
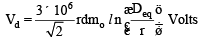
- For a three-phase line with an equivalent spacing Deq, the phase value of the critical disruptive voltage is obtained by replacing the spacing by Deq in the formula for the single-phase case.
Visual Critical Voltage
Although corona starts as soon as the local field reaches the critical intensity, visible corona (a luminous glow) appears only at a somewhat higher field intensity because ions must gain a finite amount of energy to produce further ionisation by collisions. The field at which visible corona first appears is called the visual critical intensity.
- The visual critical intensity is obtained by including an irregularity factor mv (accounts for surface irregularities and ion energy requirements).
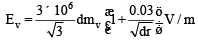
Here mv denotes the irregularity factor for visual corona.
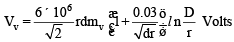
- The visual critical voltage for a single-phase line is obtained by integrating the visual critical intensity expression for a conductor geometry.
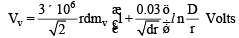
For a three-phase line, a corresponding expression using equivalent spacing gives the visual critical voltage per phase.
- Typical values of the irregularity factor are about 0.72 for local corona and about 0.82 for developed (diffuse) corona on standard conductors.
Corona Loss
Corona loss is the electric power dissipated from a high-voltage transmission line due to ionisation and radiation of energy by corona discharge. Corona loss appears as power loss per unit length per phase and increases with severity of corona.
- Corona loss has little effect on voltage regulation of the line but reduces the overall transmission efficiency.
Peek's Formula
Peek's empirical formula gives corona loss per phase per unit length for fair-weather conditions. The formula is commonly written in terms of phase voltage and the disruptive critical voltage.
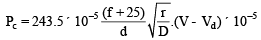
In the formula above:
- Pc = Corona loss in kW per km per phase
- V = RMS value of phase voltage in kV
- Vd = RMS value of disruptive (critical) voltage in kV
- r = Radius of conductor in metres
- D = Spacing (or equivalent spacing) between conductors in metres
- f = System frequency in Hz
Note: Peek's formula is formulated for fair-weather conditions. For stormy or heavily contaminated weather the disruptive critical voltage used in the formula is often taken as about 80% of the fair-weather value to account for enhanced ionisation and increased corona activity.
Peterson's Formula
Peterson's empirical expression is another form used to estimate corona loss under certain conductor and spacing conditions.
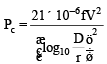
In this expression, F is a factor which depends on the ratio of conductor spacing to conductor radius and other geometric parameters.

- Remember: Peterson's formula is generally used when the given geometric ratio (as indicated by the referenced image) is less than 1.8.
- Peek's formula is preferred when that geometric ratio is greater than 1.8.
Factors Affecting Corona Loss
Effect of Frequency
- Corona loss is directly proportional to the system frequency. Higher frequency increases the rate at which ions are accelerated and de-accelerated, increasing energy dissipation.
Effect of System Voltage
- Greater the phase voltage, greater the electric field around conductors and hence greater the corona loss.
- When the operating voltage V is large compared with the disruptive voltage Vd, corona loss increases very rapidly with further increase in voltage.
Effect of Air Conductivity
- The effective conductivity of the air depends on the number of ions per unit volume, the ion size and the charge per ion.
- Greater conductivity of the surrounding medium leads to increased corona loss because more current flows through the ionised region.
Effect of Air Density
- Corona loss increases as air density decreases (for example, at high altitudes). Reduced air density lowers the breakdown strength, so corona occurs more readily.
- A transmission line passing through hilly or mountainous regions will usually display higher corona loss than a similar line in the plains.
Effect of Rain, Dust and Pollution
- Rain, dust, salt spray or other contamination on the conductor surface increases corona loss.
- The effect of contamination is more pronounced for conductors of larger diameter where droplets or deposits increase local field distortion.
Effect of Conductor Radius and Configuration
- A larger conductor radius reduces the surface electric field intensity for a given line voltage and therefore reduces corona loss.
- ACSR conductors typically have lower corona loss than solid copper conductors of the same diameter because of effective surface geometry and skin effects.
- Bundled conductors (multiple sub-conductors per phase) increase the effective radius of the phase conductor and hence significantly reduce corona loss compared with single-conductor-per-phase lines.
Effect of Conductor Surface Condition
- Any roughness, pitting or protrusions on the conductor surface produce local enhancements of electric field and therefore increase corona loss compared with a smooth surface.
Summary: Corona is an important phenomenon in high-voltage transmission systems. Its onset and severity depend on conductor geometry, surface condition, air density, atmospheric conditions and operating voltage and frequency. Peek's and Peterson's empirical formulas are commonly used to estimate corona loss, and practical line design aims to minimise corona through conductor sizing, bundling and maintaining good surface condition.
FAQs on Corona
| 1. What is electrical engineering? |  |
| 2. What are the career opportunities in electrical engineering? | |
| 3. How important is electrical engineering in the development of renewable energy sources? | |
| 4. What skills are required to become an electrical engineer? | |
| 5. How does electrical engineering contribute to the advancements in technology? | |


 | Explore Courses for Electrical Engineering (EE) exam |
 | Get EduRev Notes directly in your Google search |