Important Graphs of Periodic Properties


Trends In Periodic Properties
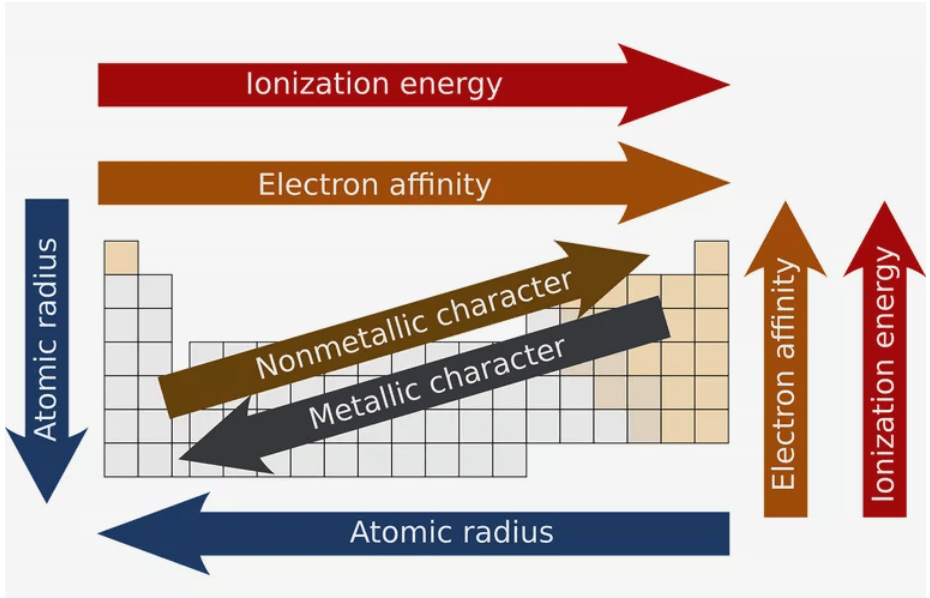
The periodic table organises elements so that repeating patterns (periodic trends) in physical and chemical properties become apparent. Important periodic properties that are commonly plotted as graphs against atomic number (Z) or position in a period/group include atomic radius, ionic radius, ionisation energy, electron gain enthalpy (electron affinity), electronegativity, and metallic/non-metallic character. Understanding the shape and causes of these graphs (effective nuclear charge, shielding, and orbital penetration) is essential for predicting behaviour of elements and their compounds.
Why graphs are useful
- Graphs make the periodic variation of a property compact and visual: peaks, troughs and sudden jumps show regularities and important exceptions.
- Comparing graphs of different properties helps connect concepts - for example, how decreasing atomic radius across a period relates to increasing ionisation energy and increasing electronegativity.
- Successive ionisation energy graphs for a given element clearly show the removal of valence electrons and the large jump when a core electron must be removed.
Key concepts used to interpret graphs
- Effective nuclear charge (Zeff): net positive charge felt by an electron after shielding by other electrons; larger Zeff → stronger attraction → smaller radius → larger ionisation energy.
- Shielding or screening effect: inner electrons partially block the nuclear attraction on outer electrons; greater shielding lowers Zeff.
- Orbital penetration: s-orbitals penetrate closer to the nucleus than p, d, f; this affects relative sizes and energies and can cause irregularities in trends.
- Isoelectronic species: same number of electrons but different nuclear charge; size decreases as nuclear charge increases.
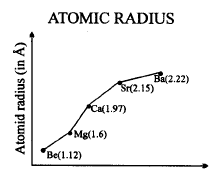
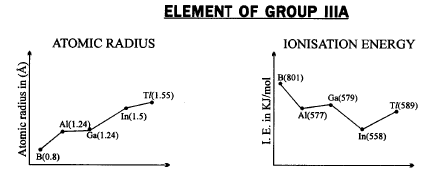
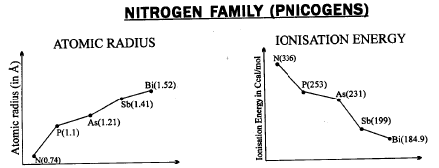
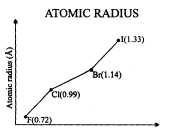
Atomic radius - graph and trend
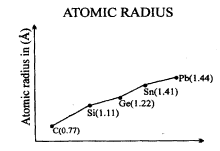
The atomic radius generally decreases across a period (left → right) and increases down a group (top → bottom).
Explanation:
- Across a period, electrons are added to the same shell while nuclear charge increases; shielding does not increase much, so Zeff increases and atomic size decreases.
- Down a group, electrons occupy higher principal quantum number shells (n increases); these shells are larger and screening by inner electrons increases, so atomic size increases.
Graph shape: across a period the radius shows a steady decrease; down a group the radius shows a steady increase from one element to the next.
Example (isoelectronic series): For O2-, F-, Na+, Mg2+ (all 10 electrons), ionic size order is O2- > F- > Na+ > Mg2+ because nuclear charge increases.
Ionic radius
Ionic radius depends on whether the ion is a cation or anion. Cations are smaller than their parent atoms (loss of an outer shell or greater Zeff). Anions are larger (added electron increases electron-electron repulsion and usually does not increase nuclear charge).
Within isoelectronic series, radius decreases with increasing nuclear charge.
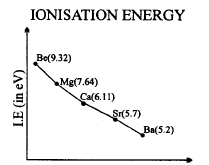
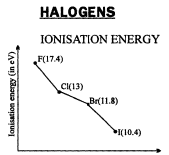
Ionisation energy - graphs and successive ionisations
Ionisation energy (IE) is the enthalpy change required to remove an electron from a gaseous atom/ion. The first ionisation energy is IE1, the second IE2, and so on.
- IE generally increases across a period due to increasing Zeff and decreasing atomic radius.
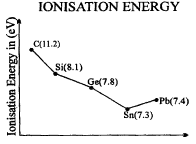
- IE generally decreases down a group due to increasing atomic size and greater shielding.
- Successive IEs increase for a given element: IE1 < IE2 < IE3 ...
- There is a very large jump in successive ionisation energy when removal of an electron requires breaking into a noble gas core (that is, removal of a core electron rather than a valence electron).
Graph features:
- Across a period the IE graph shows an overall rise with small dips at elements where electron removal leads to a more stable electronic configuration (for example, from a filled or half-filled subshell).
- Successive IE vs. ionisation number for a single element shows a roughly steady rise with one very large step when a core electron must be removed - this identifies the number of valence electrons.
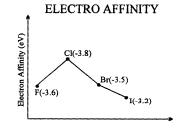
Electron gain enthalpy (Electron affinity)
Electron gain enthalpy measures the energy change when an electron is added to a gaseous atom.
- More negative value means the atom gains an electron more easily (greater tendency to form an anion).
- Tends to become more negative across a period (left → right) though there are exceptions due to subshell structure; trends down a group are less regular because added electron enters higher energy levels.
- Noble gases have positive (endothermic) electron gain enthalpies because an added electron must occupy a higher shell.
- Addition of a second electron to an already negatively charged ion is opposed by electrostatic repulsion and usually is endothermic (requires energy), e.g. formation of O2-, S2-.
Example noted in observations: the negative value of electron gain enthalpy of Cl > F because in chlorine the added electron enters a larger, more diffuse 3p subshell where electron-electron repulsion is less severe than in the compact 2p subshell of fluorine; a similar comment applies to S > O.
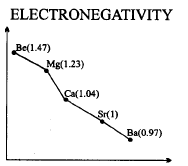
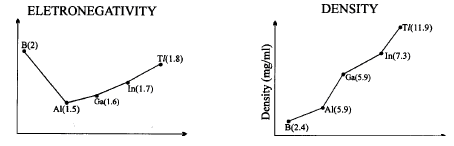
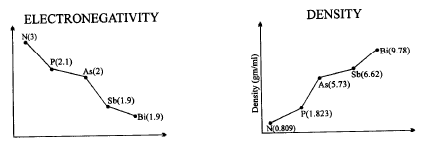
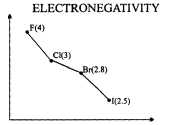
Electronegativity
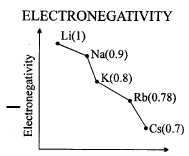
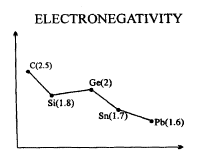
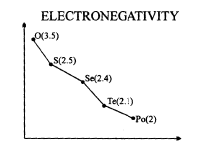
Electronegativity is a relative measure of the tendency of an atom in a molecule to attract bonding electrons to itself. It increases across a period and decreases down a group.
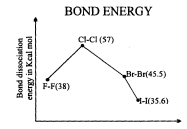
Pauling's relation (useful when bond energies are known): the electronegativity difference between two atoms is proportional to the square root of the extra stabilisation energy (Δ) of the bond:
Δχ = 0.208 × √Δ where Δ is the extra bond energy in kcal mol-1.
Metallic and non-metallic character
Metallic character (tendency to lose electrons) increases down a group and decreases across a period. Non-metallic character (tendency to gain electrons) shows the opposite trend.
Reactivity of metals is related to ease of losing electrons (smaller IE), while reactivity of non-metals relates to ability to gain electrons (more negative electron gain enthalpy).
Alkali Metals
The alkali metals (Group 1) show characteristic trends that are clear in graphs of their properties:
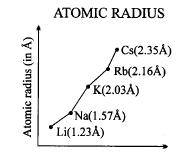
- Atomic and ionic radii increase down the group (addition of electron shells).
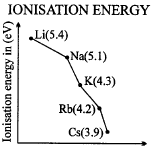
- Ionisation energies decrease down the group - they lose the valence electron more easily as the outer electron is further from nucleus and better shielded.
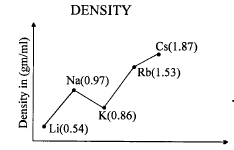
- Reactivity with water and halogens increases down the group (e.g., Li < Na < K < Rb < Cs).
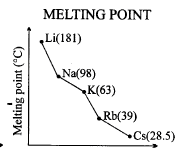
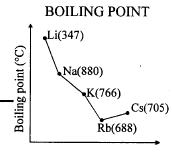
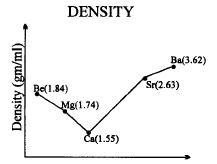
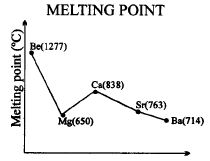
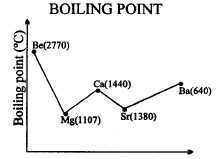
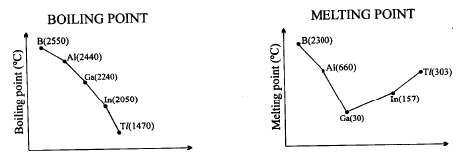
- Melting and boiling points generally decrease down the group for the lighter alkali metals (due to weaker metallic bonding from larger interatomic distances), with anomalies associated with crystal structure.
Graphs for alkali metals typically display monotonic trends down the group - good examples for classroom sketches include plots of atomic radius vs. period number and IE1 vs. period number.
Carbon Family
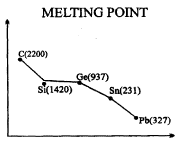
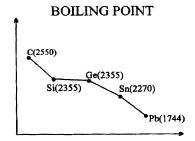
The carbon family (Group 14) shows mixed metallic and non-metallic behaviour down the group: carbon is non-metallic, silicon and germanium are metalloids, tin and lead are metallic.
- Atomic size increases down the group.
- Ionisation energy decreases down the group.
- Covalent character of compounds generally decreases down the group while metallic character increases.
- Multiple bonding (C=C, C≡C) is common for carbon but becomes less prevalent down the group due to poorer p-orbital overlap.
Chalcogens
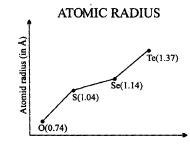
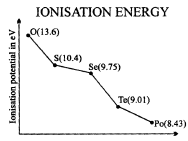
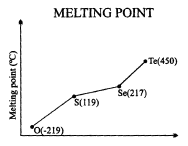
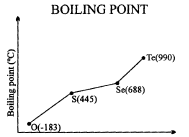
The chalcogens (Group 16) include oxygen, sulfur, selenium, tellurium and polonium. Trends include:
- Atomic radius increases down the group.
- Electron gain enthalpy is generally more negative across the period (but with exceptions); O and S show differences due to small size and repulsions in 2p vs 3p subshells.
- Oxides change from acidic (oxygen) to amphoteric to basic as one moves down the group.
3-d Series
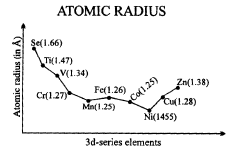
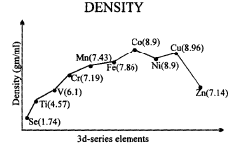
The 3d transition series (Sc → Zn) shows more complex trends because d-orbital occupancy affects size, ionisation energy, multiple oxidation states, and magnetic properties. Graphs of atomic radii across the series show a slow decrease (the so-called 3d contraction) and successive ionisation energy plots show variations due to electron configurations and half-filled or filled subshell stabilities.
Points To Remember
- The basis of Mendeleev's periodic table was his periodic law: the physical and chemical properties of the elements are a periodic function of their atomic masses (as he observed), which allowed prediction of undiscovered elements.
- Moseley showed experimentally that a plot of the square root of the frequency (or simply frequency) of X-rays emitted versus atomic number (Z) is linear; this established atomic number, not atomic mass, as the proper ordering principle for the periodic table.
- The long form of the modern periodic table contains seven periods (horizontal rows) and eighteen groups (vertical columns).
- In the modern periodic table, the period number indicates the principal quantum number (n) of the outermost electrons for the main group elements.
- The number of elements in each period is twice the number of orbitals available in that principal shell (equivalently, the number often equals 2n² for a full shell), reflecting how many electrons can occupy the available subshells.
- A group consists of a series of elements having similar valence shell electronic configurations and therefore similar chemical properties.
- In the modern periodic table each block (s, p, d, f) contains a number of columns equal to the number of electrons that can occupy that subshell (s → 2, p → 6, d → 10, f → 14).
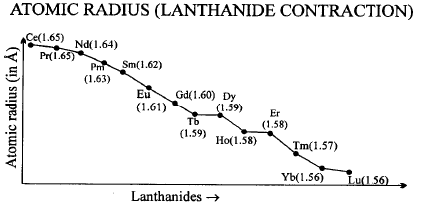
- The inner transition series are the lanthanides (4f) and the actinides (5f); these are placed separately to keep the table compact while preserving the sequence of filling.
- Metals comprise the majority of elements and appear on the left and centre of the periodic table. Silicon, germanium, arsenic, antimony, selenium and tellurium are examples of metalloids (semi-metals) with intermediate properties.
- The combined effect of attractive force due to the nucleus and repulsive force due to intervening electrons acting on the valence electrons results in shielding (screening) effect - valence electrons experience less attraction from the nucleus because of inner electrons.
- Covalent radius < metallic (crystal) radius < van der Waals radius.
- Species having the same number of electrons but different nuclear charges are called isoelectronic. Their sizes are inversely proportional to their effective nuclear charge (higher nuclear charge → smaller size).
- The smaller the ionisation energy, the easier it is for a neutral atom to form a positive ion in the gaseous state. Successive ionisation energies follow IE1 < IE2 < IE3 ...
- The greatest increase in ionisation enthalpy is experienced when electrons are removed from a noble gas (core) configuration; a large jump in successive ionisation energies marks the end of valence electrons.
- Electron gain enthalpy provides a measure of the ease with which an atom adds an electron to form an anion; more negative values indicate greater tendency to accept an electron.
- The negative value of electron gain enthalpy of Cl is greater (more negative) than that of F because the added electron in Cl occupies a 3p orbital where electron-electron repulsion is less than in the compact 2p orbital of F. A similar pattern is observed for S vs O.
- Noble gases have positive (endothermic) electron gain enthalpies because an entering electron must go into the next higher shell, which is energetically unfavourable.
- Addition of a second electron to an anion is opposed by electrostatic repulsion and is usually endothermic (requires energy), e.g. formation of O2-, S2-.
- The relative reactivity of metals increases as ionisation energies decrease. The relative reactivity of non-metals increases with more negative electron gain enthalpies.
- According to Pauling, the electronegativity difference between two atoms is related to the extra bond energy Δ (in kcal mol-1) by Δχ = 0.208 × √Δ.
- The acidic character of oxides generally increases when the electronegativity difference between the element and oxygen (E-O) decreases; thus oxide character correlates with metallic/non-metallic nature of the element.
Final summary: Graphs of periodic properties give a clear visual of how atomic structure (Zeff, shielding, shell structure and subshell filling) governs trends. Recognising the characteristic shapes - steady rises and falls, small anomalies due to subshell stability, and sudden jumps for successive ionisation energies - is essential for solving prediction and explanation problems related to element behaviour.
FAQs on Important Graphs of Periodic Properties
| 1. What are the trends in periodic properties for alkali metals? |  |
| 2. How do the periodic properties of the carbon family vary? | |
| 3. What are the properties of chalcogens in terms of periodic trends? | |
| 4. What are some important graphs of periodic properties? | |
| 5. What are some frequently asked questions about periodic properties in exams? | |


