All About Microsoft Office

Microsoft Office, commonly called MS Office, is a collection of productivity applications developed by Microsoft to assist with document creation, data analysis, presentations and communication. The suite evolved through the late 1980s and early 1990s and has continued to develop into both offline releases (for example, Office 2019) and cloud-based subscription services (Microsoft 365).
MS Office: Overview
Definition: Microsoft Office is a suite of closed‐source productivity applications that includes word processing, spreadsheet, presentation, database and communication tools.
History & key facts: Development and packaging of Microsoft Office began in the late 1980s. Microsoft introduced the Office suite for Windows publicly in November 1990 with an announcement by Bill Gates. Over the years, the suite has grown in scope and function; multiple versions have been released and the suite is distributed both as standalone boxed/one‐time purchases (for example, Office 2019) and as a cloud subscription service (Microsoft 365).
- Core early applications: MS Word, MS Excel, MS PowerPoint.
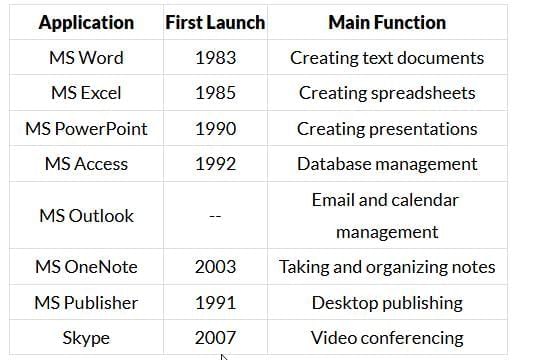
- Scope expansion: The suite now includes database tools (Access), publishing tools (Publisher), email and calendar (Outlook), collaboration and telephony/video tools (Skype, Teams), and many specialised features for business and education.
- File formats: Common native file extensions are .doc / .docx for Word, .xls / .xlsx for Excel, and .ppt / .pptx for PowerPoint.
Core Applications - Detailed Guide
MS Word (Word Processor)
What it is: MS Word is a word-processing package used to create, edit and format text documents such as letters, reports, memos, newsletters and books. It supports inserting images, tables, charts and other objects to produce professional printed and electronic documents.
- Common uses: Letters, articles, reports, notices, envelopes, newsletters, brochures and books.
- File types: Files are typically saved with .doc or .docx extensions.
- Formatting & editing: Word provides comprehensive formatting (fonts, sizes, colours), paragraph controls (alignment, line spacing, indents), styles, headers/footers, page numbering and section breaks.
- Rich content: You can insert graphs, photographs, charts, drawings and tables to illustrate content.
- Hidden features: Many advanced tools (styles, mail merge, tracked changes, macros) are available once discovered and learned.
Text selection and basic editing: To apply most commands to existing text you must first select the text. Keyboard selection examples include using Shift + Right Arrow to extend selection one character to the right, or Shift + Left Arrow to extend selection one character to the left.
- Home menu: Copy, cut, paste, format text (font, font size, colour), change text case (uppercase, lowercase), alignment (left, centre, right, justify), set line spacing, format paragraphs, and insert bullets or numbering. Use Ctrl + F to find text and the Replace option to replace text.
- Insert menu: Insert images, screenshots, tables, charts, shapes, hyperlinks, equations, symbols, headers, footers and page numbers.
- Design menu: Apply ready‐made themes and font styles for headings and body text to create a consistent visual appearance.
- Page Layout menu: Control margins, page orientation, paragraph spacing, and indents to manage document layout.
- References menu: Insert citations and generate a bibliography in formats such as APA and MLA; use this after entering source details.
- Review menu: Check spelling and grammar, track changes, add comments and protect the document from unauthorised editing.
Practical tip: Use styles (Heading 1, Heading 2, Normal) to keep long documents well structured; they help create automatic tables of contents and consistent formatting.
Visual reference:
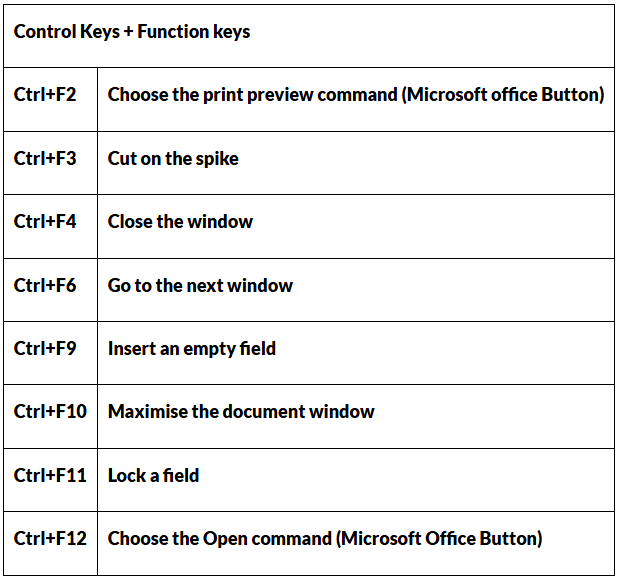
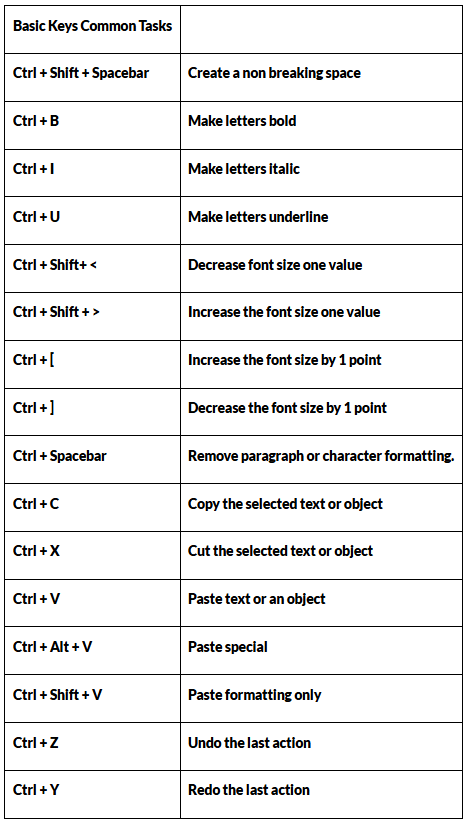
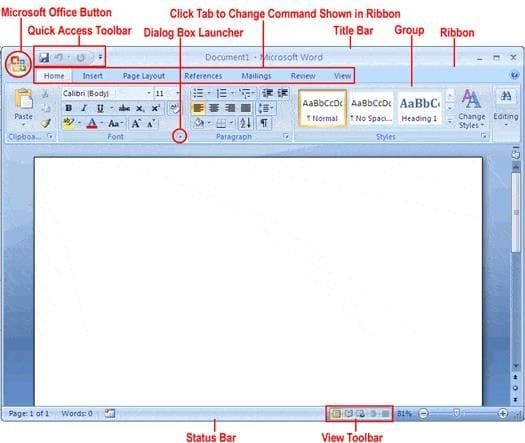 MS- Word
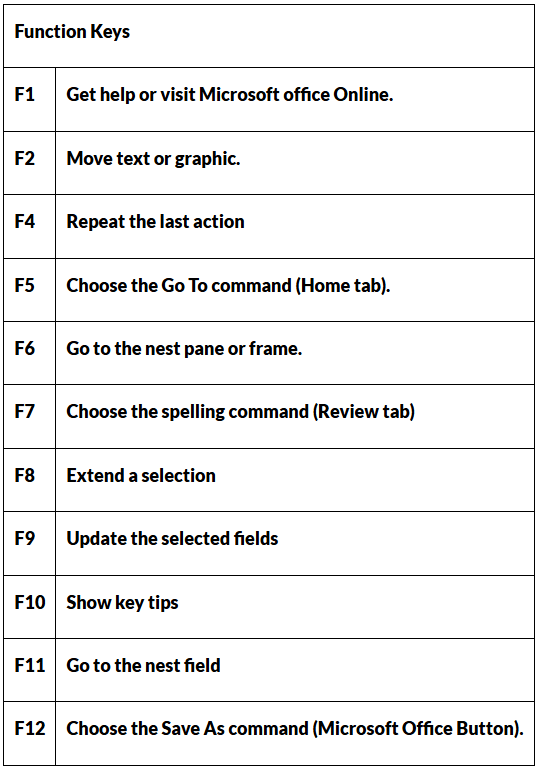
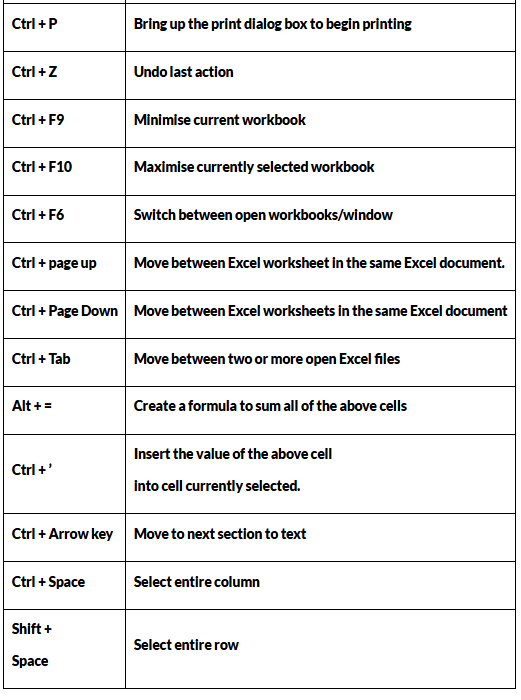
Shortcut keys and quick operations
MS Excel (Spreadsheet)
What it is: MS Excel is a spreadsheet program that organises numerical and textual data in a grid of rows and columns. It is designed for calculations, data analysis, charting and basic data management.
- Structure: Excel is composed of rows and columns which intersect to form cells. Each cell has a unique address made up of a column letter and a row number (for example, A1, B2).
- Common uses: Financial calculations, sales data, budgets, statistical analysis, pivot tables and visualisations such as charts and graphs.
- Formulas and functions: Excel supports formulas prefixed by an equal sign (=). Built‐in functions include SUM, AVERAGE, COUNT, IF, VLOOKUP, INDEX/MATCH and statistical functions. Example: =AVERAGE(A1:A10) computes the average of cells A1 through A10.
- Data menu: Sort and filter without altering original data, perform data validation, remove duplicates and use tools such as Text to Columns.
- Analysis tools: PivotTables, What‐If analysis, Goal Seek and Data Analysis add‐ins perform advanced statistical tests and scenario planning.
Visual reference:
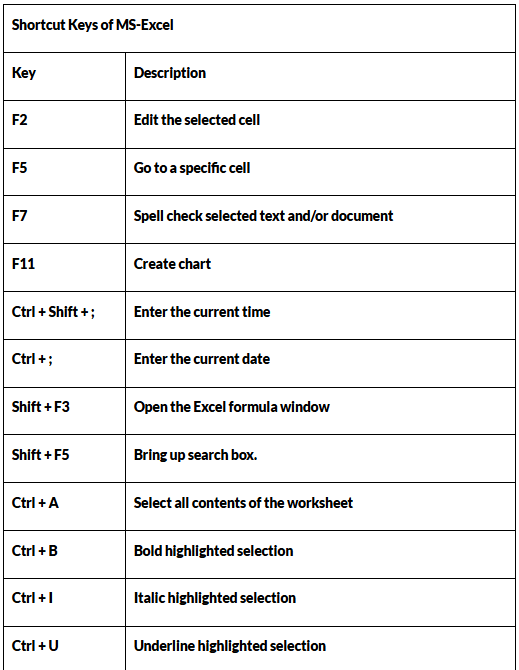
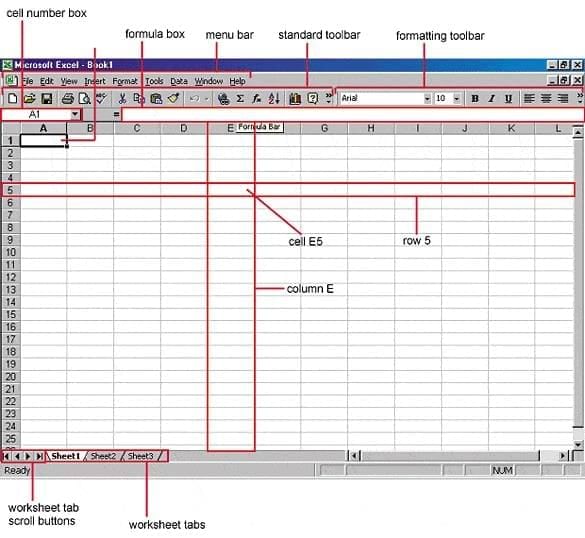 MS-Excel
Key functions and examples
- Example calculation: Use formulas and cell references so that changes in source data automatically update all dependent results.
- Graphical outputs: Create bar charts, line graphs, pie charts and scatter plots quickly from selected cell ranges.
- Statistical functions: Excel supports basic and advanced statistical operations, including regressions and correlation; specialised add‐ins are available for t‐tests and ANOVA.
Shortcut keys and quick operations
MS PowerPoint (Presentation)
What it is: MS PowerPoint is a presentation application used to create slide‐based visual presentations. Slides may contain text, images, tables, charts, audio and video.
- Slides: A presentation is a sequence of slides; each slide is a canvas for text and multimedia.
- Uses: Classroom lectures, business presentations, project defence/reporting, training modules and online slide decks.
- File types: Presentations are typically saved with .ppt or .pptx extensions.
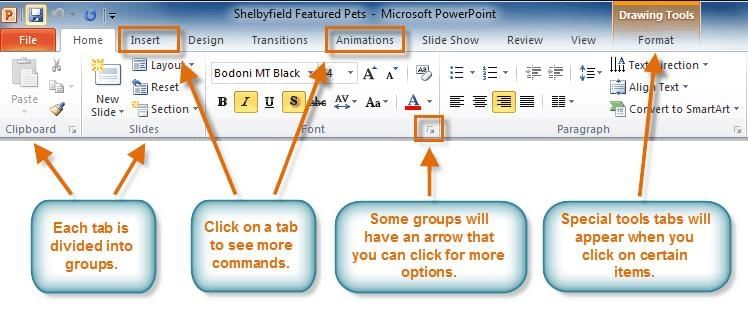
- Insert menu: Add pictures, videos, audio, tables, charts and shapes to slides.
- Design menu: Apply themes, background styles and templates for a professional look.
- Transitions & animations: Transitions control how slides move from one to the next; animations control how text and objects enter or exit a slide.
- Slideshow menu: Run the slide show in full screen, set slide timings and rehearse presentations for timed delivery.
Visual reference:
 MS- Powerpoint
Other Important Microsoft Applications and Services
Microsoft Outlook
- Function: Personal information manager that handles email, calendar, tasks and contacts.
- Use: Organising schedules, sending and receiving emails, managing meetings and tasks.
- Availability: Outlook is distributed as part of Microsoft Office and Microsoft 365; a free Outlook email account can be created online, while organisational use often requires a licence.
Note: Using the MS Outlook application within the Office suite typically requires a paid licence, but creating a free Outlook email account is free of cost.
Microsoft Publisher
- Function: Desktop publishing tool for entry‐level graphic design and page layout.
- Use: Create templates, cover pages, flyers, brochures and small publications.
- History & file type: The first version was released in 1991; files commonly use the .pub extension.
Microsoft Access
- Function: Desktop relational database management system for small to medium datasets.
- Use: Data entry forms, queries, reports and simple applications for organisations that need structured data management.
- History: Access was first launched in November 1992 and is included in many Office suites for desktop database tasks.
Skype
- Function: Telecommunication application for voice and video calls, messaging and conferencing.
- Founders & history: Skype was founded by Niklas Zennstrom and Janus Friis; the first beta was released on 29 August 2003. Microsoft acquired Skype in 2011.
- Use: Video conferencing, online meetings and cross‐device communication (computers, mobiles, tablets).
FAQs on All About Microsoft Office
| 1. What are the main components and features of Microsoft Office that I need to know for UPSC GK? |  |
| 2. How does Microsoft Word differ from Excel in terms of functionality and usage? | |
| 3. What is the purpose of Microsoft PowerPoint and why is it important for presentations? | |
| 4. Which Microsoft Office application should I use for managing large datasets and performing calculations? | |
| 5. What are the key differences between Microsoft Access and Excel for database management? | |


