NABARD Practice Test - 5 - Banking Exams MCQ
30 Questions MCQ Test - NABARD Practice Test - 5

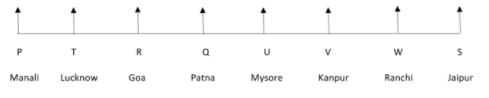
Eight people, viz P, Q, R, S, T, U, V, and W are sitting in a straight line facing North. Each of them belongs to different cities, viz Patna, Ranchi, Kanpur, Lucknow, Goa, Manali, Mysore, and Jaipur but not necessarily in the same order.
(i)V sits third to the right of the person who belongs to Goa. The person who belongs to Jaipur sit second to the right of V. P and T are immediate neighbours of each other. Neither P nor T belongs to Goa or Jaipur. Neither P nor T is an immediate neighbor of V.
(ii) W sits third to the right of the person who belongs to Patna. Neither P nor T belongs to Patna. W does not belongs to Jaipur.
(iii) Only two people sit between T and the person who belongs to Mysore. The person who belongs to Ranchi sit on the immediate left of S.
(iv) Only one person sits between T and Q. R sits second to left of one who belongs to Mysore.
(v)T does not belongs to Kanpur.
(vi) The one who belongs to Manali sits at the extreme end of the line.
Q. Who among the following sits exactly between T and Q?
Eight people, viz P, Q, R, S, T, U, V, and W are sitting in a straight line facing North. Each of them belongs to different cities, viz Patna, Ranchi, Kanpur, Lucknow, Goa, Manali, Mysore, and Jaipur but not necessarily in the same order.
(i)V sits third to the right of the person who belongs to Goa. The person who belongs to Jaipur sit second to the right of V. P and T are immediate neighbours of each other. Neither P nor T belongs to Goa or Jaipur. Neither P nor T is an immediate neighbor of V.
(ii) W sits third to the right of the person who belongs to Patna. Neither P nor T belongs to Patna. W does not belongs to Jaipur.
(iii) Only two people sit between T and the person who belongs to Mysore. The person who belongs to Ranchi sit on the immediate left of S.
(iv) Only one person sits between T and Q. R sits second to left of one who belongs to Mysore.
(v)T does not belongs to Kanpur.
(vi) The one who belongs to Manali sits at the extreme end of the line.
Q. ‘W’ is related to ‘Mysore’ in a certain way based on the above arrangement. ‘Q’ is related to ‘Lucknow’ following the same pattern. ‘_____’ is related to ‘Goa’ following the same pattern.
| 1 Crore+ students have signed up on EduRev. Have you? Download the App |
Eight people, viz P, Q, R, S, T, U, V, and W are sitting in a straight line facing North. Each of them belongs to different cities, viz Patna, Ranchi, Kanpur, Lucknow, Goa, Manali, Mysore, and Jaipur but not necessarily in the same order.
(i) V sits third to the right of the person who belongs to Goa. The person who belongs to Jaipur sit second to the right of V. P and T are immediate neighbours of each other. Neither P nor T belongs to Goa or Jaipur. Neither P nor T is an immediate neighbor of V.
(ii) W sits third to the right of the person who belongs to Patna. Neither P nor T belongs to Patna. W does not belongs to Jaipur.
(iii) Only two people sit between T and the person who belongs to Mysore. The person who belongs to Ranchi sit on the immediate left of S.
(iv) Only one person sits between T and Q. R sits second to left of one who belongs to Mysore.
(v) T does not belongs to Kanpur.
(vi) The one who belongs to Manali sits at the extreme end of the line.
Q. Which of the following is true regarding S?
Eight people, viz P, Q, R, S, T, U, V, and W are sitting in a straight line facing North. Each of them belongs to different cities, viz Patna, Ranchi, Kanpur, Lucknow, Goa, Manali, Mysore, and Jaipur but not necessarily in the same order.
(i)V sits third to the right of the person who belongs to Goa. The person who belongs to Jaipur sit second to the right of V. P and T are immediate neighbours of each other. Neither P nor T belongs to Goa or Jaipur. Neither P nor T is an immediate neighbor of V.
(ii) W sits third to the right of the person who belongs to Patna. Neither P nor T belongs to Patna. W does not belongs to Jaipur.
(iii) Only two people sit between T and the person who belongs to Mysore. The person who belongs to Ranchi sit on the immediate left of S.
(iv) Only one person sits between T and Q. R sits second to left of one who belongs to Mysore.
(v) T does not belongs to Kanpur.
(vi) The one who belongs to Manali sits at the extreme end of the line.
Q. How many people sit between R and the person who belongs to Ranchi?
Eight people, viz P, Q, R, S, T, U, V, and W are sitting in a straight line facing North. Each of them belongs to different cities, viz Patna, Ranchi, Kanpur, Lucknow, Goa, Manali, Mysore, and Jaipur but not necessarily in the same order.
(i)V sits third to the right of the person who belongs to Goa. The person who belongs to Jaipur sit second to the right of V. P and T are immediate neighbours of each other. Neither P nor T belongs to Goa or Jaipur. Neither P nor T is an immediate neighbor of V.
(ii) W sits third to the right of the person who belongs to Patna. Neither P nor T belongs to Patna. W does not belongs to Jaipur.
(iii) Only two people sit between T and the person who belongs to Mysore. The person who belongs to Ranchi sit on the immediate left of S.
(iv) Only one person sits between T and Q. R sits second to left of one who belongs to Mysore.
(v) T does not belongs to Kanpur.
(vi) The one who belongs to Manali sits at the extreme end of the line.
Q. Who among the following is sitting at extreme ends of the line?
Directions
In each of the questions below, some statements are given followed by some conclusions. You have to consider the statements to be true even if they seem to be at variance with commonly known facts. You have to decide which of the following conclusions logically follows from the given statements. Give answer.
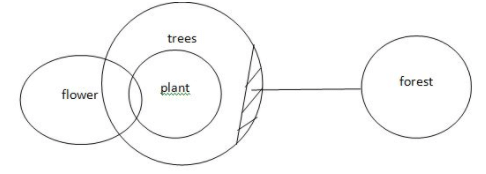
Statements: Some flower are plant.
All plant are trees.
Some trees are not forest.
Conclusions: I. some forest are flower.
II. some forest are plant.
III. some trees are flower.
Directions
In each of the questions below, some statements are given followed by some conclusions. You have to consider the statements to be true even if they seem to be at variance with commonly known facts. You have to decide which of the following conclusions logically follows from the given statements. Give answer.
Statements: Some flower are plant.
All plant are trees.
Some trees are not forest.
Conclusions: I. some forest are flower.
II. some forest are plant.
III. some trees are flower.
Directions
Study the following information carefully and answer the questions given below:
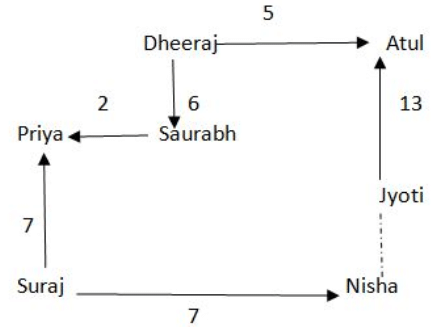
Atul is 13m to the north of Jyoti . Atul is 5m to the east of Dheeraj. Dheeraj is 6m to the north of Saurabh. Priya is 2m west of Saurabh. Priya is 7m north of Suraj. Nisha is 7m east of Suraj.
Q. How far is Atul from Nisha?
Directions
Study the following information carefully and answer the questions given below:
Atul is 13m to the north of Jyoti . Atul is 5m to the east of Dheeraj. Dheeraj is 6m to the north of Saurabh. Priya is 2m west of Saurabh. Priya is 7m north of Suraj. Nisha is 7m east of Suraj.
Q. How far is Atul from Nisha?

In a class of 25 students, a girl is ranked 10th. When two girls joined, her rank was dropped by one. What is her new rank from the end?
Directions
Each question given below consists of a statement, followed by two arguments numbered I and II. You have to decide which of the arguments a ‘strong’ argument is and which a ‘weak’ argument is.
Statement: Should there be a complete ban on extracurricular activities in college.
Arguments:
I. No, there is nothing wrong in participating in extracurricular activities in college.
II. Yes, Students are giving their more time to extracurricular activities in college.
Directions
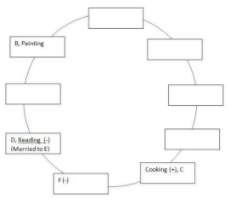
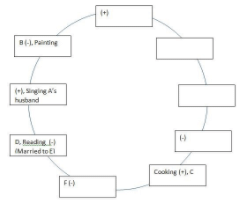
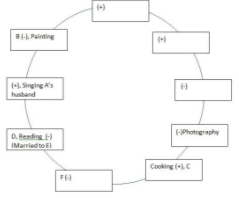
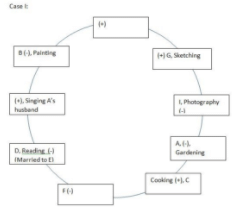
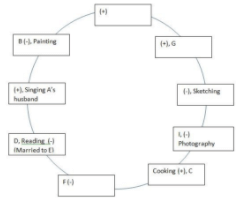
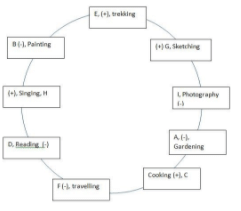
1. Nine people (A, B, C, D, E, F, G, H, I) are sitting around a round table facing the center, not necessarily in the same order. Among them are 4 married couples and 1 pair of siblings. One of the siblings is unmarried. Each person has a different hobby (Singing, travelling, painting, gardening, trekking, sketching, photography, cooking, Reading), not necessarily in the same order.
2. The one who likes photography sits second to the left of a male.
3. F sits to the immediate left of her brother who likes cooking.
4. A’s husband likes singing and he sits to the immediate right of the female who likes painting.
5. G’s wife sits second to his right. No male likes reading or photography.
6. The one who likes reading sits to the immediate left of C’s sister and is married to E who likes trekking.
7. Both the immediate neighbours of only B and C are of opposite gender to B and C respectively. Gender of B is opposite to C.
8. D likes reading and sits second to the right of B, who likes painting.
9. The wife of the one who sits to the immediate left of D likes gardening. I is married to C, likes photography and sits to the immediate left of the one who likes sketching.
Q. Who among the following likes travelling?
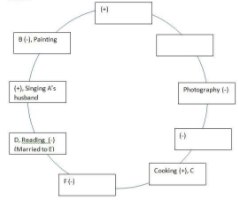
Directions
1. Nine people (A, B, C, D, E, F, G, H, I) are sitting around a round table facing the center, not necessarily in the same order. Among them are 4 married couples and 1 pair of siblings. One of the siblings is unmarried. Each person has a different hobby (Singing, travelling, painting, gardening, trekking, sketching, photography, cooking, Reading), not necessarily in the same order.
2. The one who likes photography sits second to the left of a male.
3. F sits to the immediate left of her brother who likes cooking.
4. A’s husband likes singing and he sits to the immediate right of the female who likes painting.
5. G’s wife sits second to his right. No male likes reading or photography.
6. The one who likes reading sits to the immediate left of C’s sister and is married to E who likes trekking.
7. Both the immediate neighbours of only B and C are of opposite gender to B and C respectively. Gender of B is opposite to C.
8. D likes reading and sits second to the right of B, who likes painting.
9. The wife of the one who sits to the immediate left of D likes gardening. I is married to C, likes photography and sits to the immediate left of the one who likes sketching.
Q. Which among the following is not a husband wife pair?
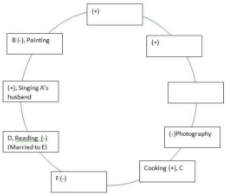
Directions
1. Nine people (A, B, C, D, E, F, G, H, I) are sitting around a round table facing the center, not necessarily in the same order. Among them are 4 married couples and 1 pair of siblings. One of the siblings is unmarried. Each person has a different hobby (Singing, travelling, painting, gardening, trekking, sketching, photography, cooking, Reading), not necessarily in the same order.
2. The one who likes photography sits second to the left of a male.
3. F sits to the immediate left of her brother who likes cooking.
4. A’s husband likes singing and he sits to the immediate right of the female who likes painting.
5. G’s wife sits second to his right. No male likes reading or photography.
6. The one who likes reading sits to the immediate left of C’s sister and is married to E who likes trekking.
7. Both the immediate neighbours of only B and C are of opposite gender to B and C respectively. Gender of B is opposite to C.
8. D likes reading and sits second to the right of B, who likes painting.
9. The wife of the one who sits to the immediate left of D likes gardening. I is married to C, likes photography and sits to the immediate left of the one who likes sketching.
Q. If the hobbies of husbands and wives are exchanged, what will be the hobby of the one sitting third to the right of C?
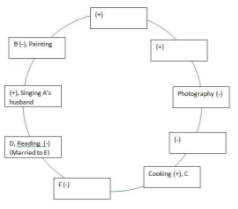
Directions
1. Nine people (A, B, C, D, E, F, G, H, I) are sitting around a round table facing the center, not necessarily in the same order. Among them are 4 married couples and 1 pair of siblings. One of the siblings is unmarried. Each person has a different hobby (Singing, travelling, painting, gardening, trekking, sketching, photography, cooking, Reading), not necessarily in the same order.
2. The one who likes photography sits second to the left of a male.
3. F sits to the immediate left of her brother who likes cooking.
4. A’s husband likes singing and he sits to the immediate right of the female who likes painting.
5. G’s wife sits second to his right. No male likes reading or photography.
6. The one who likes reading sits to the immediate left of C’s sister and is married to E who likes trekking.
7. Both the immediate neighbours of only B and C are of opposite gender to B and C respectively. Gender of B is opposite to C.
8. D likes reading and sits second to the right of B, who likes painting.
9. The wife of the one who sits to the immediate left of D likes gardening. I is married to C, likes photography and sits to the immediate left of the one who likes sketching.
Q. Which husband is sitting farthest from his wife when counting in anti clockwise direction (starting from the husband)?
Directions
1. Nine people (A, B, C, D, E, F, G, H, I) are sitting around a round table facing the center, not necessarily in the same order. Among them are 4 married couples and 1 pair of siblings. One of the siblings is unmarried. Each person has a different hobby (Singing, travelling, painting, gardening, trekking, sketching, photography, cooking, Reading), not necessarily in the same order.
2. The one who likes photography sits second to the left of a male.
3. F sits to the immediate left of her brother who likes cooking.
4. A’s husband likes singing and he sits to the immediate right of the female who likes painting.
5. G’s wife sits second to his right. No male likes reading or photography.
6. The one who likes reading sits to the immediate left of C’s sister and is married to E who likes trekking.
7. Both the immediate neighbours of only B and C are of opposite gender to B and C respectively. Gender of B is opposite to C.
8. D likes reading and sits second to the right of B, who likes painting.
9. The wife of the one who sits to the immediate left of D likes gardening. I is married to C, likes photography and sits to the immediate left of the one who likes sketching.
Q. Whose spouse sits second to the left of the one who likes trekking?
Directions
Read the passage given below and answer the questions based on it. Some of the words have been highlighted in bold to help you locate them while answering the questions.
As prolonged drought and extreme temperatures have taken their terrible toll on food crops in recent years, nations have tended to focus on regional episodes, such as a single drought-afflicted state or region. Now, scientists have assessed the global scale of food crop disasters for the first time — and the news is not good.
In a new study, researchers from Canada and the United Kingdom estimate that cereal harvests — including rice, wheat and maize — decreased by an average of 9 to10 percent during droughts and heat waves between 1964 and 2007, with the worst effects seen in North America, Europe, and Australia and its neighboring islands. Furthermore, the impact has grown larger in recent years. With climate change likely to exacerbate extreme weather and make it more common in the future, the study is perhaps the most comprehensive examination yet of the historic impact of extreme weather on global crop production.
The findings from the new research may help guide agricultural priorities in international disaster risk reduction, as well as adaptation efforts. "We can avoid a worsening food-security situation if we invest in adapting our crops to these extremes immediately, and especially if we step up and make solid commitments to avoid further climate change," saidCorey Lesk, of The Earth Institute at Columbia University and the NASA Goddard Institute for Space Studies in Manhattan and first author of the study.
Lesk and his colleagues found that the average impact of recent droughts — those between 1985 and 2007 — was a 13.7 percent loss, which is 7 percent greater than the 6.7 percent impact during droughts that occurred earlier, between 1964 and 1984. The reasons for this are not clear.
"We found that the average impact of drought disasters on crops has gotten worse," Lesk said. "But it is still debated whether droughts themselves have gotten more severe, so another explanation could be that crops have gotten more susceptible to drought over the decades. That could mean, speculatively, that we're already on the wrong path with regard to adapting our crops to a changing climate.
"The thinking is that, if crop responses to drought have gotten bigger, but there is no clear signal that the droughts have gotten worse, then that supports the alternative explanation that crops themselves have gotten more sensitive," he added. "And if they have gotten more sensitive already, that bodes ill for future crop performance in a world of worse droughts."
The researchers found that production losses due to droughts were associated with a reduction in both harvested area and yields, whereas extreme heat mainly decreased yields.Harvested area refers to the planted cropland area that is harvested in a given year. "It takes time, energy and money to harvest crops from a field, and if crops are severely enough damaged, then farmers may choose not to harvest at all," Lesk said. "You could call this a 'total crop failure,' and it shows up in the data as a drop in harvested area. Yield is the mass of grain harvest per unit area harvested — in other words, the productivity of the crops on an area basis. If a crop fails completely and is not harvested, then it doesn't end up in the yield calculations, so you have to consider both metrics to get a full picture."The scientists concluded that droughts caused partial and total damage to crops, resulting in drops in both yield and harvested area. Heat waves, in contrast, only resulted in yield declines.
Q. How according to the passage can we prevent deterioration of food security condition?
A. Working towards making our crops adaptable to the extreme weather conditions as soon as possible.
B. Improving Natural Ecology
C. Increasing green cover by planting trees in abundance so that only positive climate change occurs.
D. Vowing to prevent more climate change
Directions
Read the passage given below and answer the questions based on it. Some of the words have been highlighted in bold to help you locate them while answering the questions.
As prolonged drought and extreme temperatures have taken their terrible toll on food crops in recent years, nations have tended to focus on regional episodes, such as a single drought-afflicted state or region. Now, scientists have assessed the global scale of food crop disasters for the first time — and the news is not good.
In a new study, researchers from Canada and the United Kingdom estimate that cereal harvests — including rice, wheat and maize — decreased by an average of 9 to10 percent during droughts and heat waves between 1964 and 2007, with the worst effects seen in North America, Europe, and Australia and its neighboring islands. Furthermore, the impact has grown larger in recent years. With climate change likely to exacerbate extreme weather and make it more common in the future, the study is perhaps the most comprehensive examination yet of the historic impact of extreme weather on global crop production.
The findings from the new research may help guide agricultural priorities in international disaster risk reduction, as well as adaptation efforts. "We can avoid a worsening food-security situation if we invest in adapting our crops to these extremes immediately, and especially if we step up and make solid commitments to avoid further climate change," saidCorey Lesk, of The Earth Institute at Columbia University and the NASA Goddard Institute for Space Studies in Manhattan and first author of the study.
Lesk and his colleagues found that the average impact of recent droughts — those between 1985 and 2007 — was a 13.7 percent loss, which is 7 percent greater than the 6.7 percent impact during droughts that occurred earlier, between 1964 and 1984. The reasons for this are not clear.
"We found that the average impact of drought disasters on crops has gotten worse," Lesk said. "But it is still debated whether droughts themselves have gotten more severe, so another explanation could be that crops have gotten more susceptible to drought over the decades. That could mean, speculatively, that we're already on the wrong path with regard to adapting our crops to a changing climate.
"The thinking is that, if crop responses to drought have gotten bigger, but there is no clear signal that the droughts have gotten worse, then that supports the alternative explanation that crops themselves have gotten more sensitive," he added. "And if they have gotten more sensitive already, that bodes ill for future crop performance in a world of worse droughts."
The researchers found that production losses due to droughts were associated with a reduction in both harvested area and yields, whereas extreme heat mainly decreased yields.Harvested area refers to the planted cropland area that is harvested in a given year. "It takes time, energy and money to harvest crops from a field, and if crops are severely enough damaged, then farmers may choose not to harvest at all," Lesk said. "You could call this a 'total crop failure,' and it shows up in the data as a drop in harvested area. Yield is the mass of grain harvest per unit area harvested — in other words, the productivity of the crops on an area basis. If a crop fails completely and is not harvested, then it doesn't end up in the yield calculations, so you have to consider both metrics to get a full picture."The scientists concluded that droughts caused partial and total damage to crops, resulting in drops in both yield and harvested area. Heat waves, in contrast, only resulted in yield declines.
Q. What according to the passage is true about yield?
Directions
Read the passage given below and answer the questions based on it. Some of the words have been highlighted in bold to help you locate them while answering the questions.
As prolonged drought and extreme temperatures have taken their terrible toll on food crops in recent years, nations have tended to focus on regional episodes, such as a single drought-afflicted state or region. Now, scientists have assessed the global scale of food crop disasters for the first time — and the news is not good.
In a new study, researchers from Canada and the United Kingdom estimate that cereal harvests — including rice, wheat and maize — decreased by an average of 9 to10 percent during droughts and heat waves between 1964 and 2007, with the worst effects seen in North America, Europe, and Australia and its neighboring islands. Furthermore, the impact has grown larger in recent years. With climate change likely to exacerbate extreme weather and make it more common in the future, the study is perhaps the most comprehensive examination yet of the historic impact of extreme weather on global crop production.
The findings from the new research may help guide agricultural priorities in international disaster risk reduction, as well as adaptation efforts. "We can avoid a worsening food-security situation if we invest in adapting our crops to these extremes immediately, and especially if we step up and make solid commitments to avoid further climate change," saidCorey Lesk, of The Earth Institute at Columbia University and the NASA Goddard Institute for Space Studies in Manhattan and first author of the study.
Lesk and his colleagues found that the average impact of recent droughts — those between 1985 and 2007 — was a 13.7 percent loss, which is 7 percent greater than the 6.7 percent impact during droughts that occurred earlier, between 1964 and 1984. The reasons for this are not clear.
"We found that the average impact of drought disasters on crops has gotten worse," Lesk said. "But it is still debated whether droughts themselves have gotten more severe, so another explanation could be that crops have gotten more susceptible to drought over the decades. That could mean, speculatively, that we're already on the wrong path with regard to adapting our crops to a changing climate.
"The thinking is that, if crop responses to drought have gotten bigger, but there is no clear signal that the droughts have gotten worse, then that supports the alternative explanation that crops themselves have gotten more sensitive," he added. "And if they have gotten more sensitive already, that bodes ill for future crop performance in a world of worse droughts."
The researchers found that production losses due to droughts were associated with a reduction in both harvested area and yields, whereas extreme heat mainly decreased yields.Harvested area refers to the planted cropland area that is harvested in a given year. "It takes time, energy and money to harvest crops from a field, and if crops are severely enough damaged, then farmers may choose not to harvest at all," Lesk said. "You could call this a 'total crop failure,' and it shows up in the data as a drop in harvested area. Yield is the mass of grain harvest per unit area harvested — in other words, the productivity of the crops on an area basis. If a crop fails completely and is not harvested, then it doesn't end up in the yield calculations, so you have to consider both metrics to get a full picture."The scientists concluded that droughts caused partial and total damage to crops, resulting in drops in both yield and harvested area. Heat waves, in contrast, only resulted in yield declines.
Q. Which of the following statements regarding harvested area and yield can be inferred from the passage?
A. Yield is inversely proportional to harvested area.
B. Yield is not calculated in case of total crop failure
C. While presenting the data, in case of total crop failure, the area harvested is shown as an escalation in the data.
Directions
Read the passage given below and answer the questions based on it. Some of the words have been highlighted in bold to help you locate them while answering the questions.
As prolonged drought and extreme temperatures have taken their terrible toll on food crops in recent years, nations have tended to focus on regional episodes, such as a single drought-afflicted state or region. Now, scientists have assessed the global scale of food crop disasters for the first time — and the news is not good.
In a new study, researchers from Canada and the United Kingdom estimate that cereal harvests — including rice, wheat and maize — decreased by an average of 9 to10 percent during droughts and heat waves between 1964 and 2007, with the worst effects seen in North America, Europe, and Australia and its neighboring islands. Furthermore, the impact has grown larger in recent years. With climate change likely to exacerbate extreme weather and make it more common in the future, the study is perhaps the most comprehensive examination yet of the historic impact of extreme weather on global crop production.
The findings from the new research may help guide agricultural priorities in international disaster risk reduction, as well as adaptation efforts. "We can avoid a worsening food-security situation if we invest in adapting our crops to these extremes immediately, and especially if we step up and make solid commitments to avoid further climate change," saidCorey Lesk, of The Earth Institute at Columbia University and the NASA Goddard Institute for Space Studies in Manhattan and first author of the study.
Lesk and his colleagues found that the average impact of recent droughts — those between 1985 and 2007 — was a 13.7 percent loss, which is 7 percent greater than the 6.7 percent impact during droughts that occurred earlier, between 1964 and 1984. The reasons for this are not clear.
"We found that the average impact of drought disasters on crops has gotten worse," Lesk said. "But it is still debated whether droughts themselves have gotten more severe, so another explanation could be that crops have gotten more susceptible to drought over the decades. That could mean, speculatively, that we're already on the wrong path with regard to adapting our crops to a changing climate.
"The thinking is that, if crop responses to drought have gotten bigger, but there is no clear signal that the droughts have gotten worse, then that supports the alternative explanation that crops themselves have gotten more sensitive," he added. "And if they have gotten more sensitive already, that bodes ill for future crop performance in a world of worse droughts."
The researchers found that production losses due to droughts were associated with a reduction in both harvested area and yields, whereas extreme heat mainly decreased yields.Harvested area refers to the planted cropland area that is harvested in a given year. "It takes time, energy and money to harvest crops from a field, and if crops are severely enough damaged, then farmers may choose not to harvest at all," Lesk said. "You could call this a 'total crop failure,' and it shows up in the data as a drop in harvested area. Yield is the mass of grain harvest per unit area harvested — in other words, the productivity of the crops on an area basis. If a crop fails completely and is not harvested, then it doesn't end up in the yield calculations, so you have to consider both metrics to get a full picture."The scientists concluded that droughts caused partial and total damage to crops, resulting in drops in both yield and harvested area. Heat waves, in contrast, only resulted in yield declines.
Q. The droughts have gotten more severe which is the reason behind the damage of the crops.
This statement is
Directions
Read the passage given below and answer the questions based on it. Some of the words have been highlighted in bold to help you locate them while answering the questions.
As prolonged drought and extreme temperatures have taken their terrible toll on food crops in recent years, nations have tended to focus on regional episodes, such as a single drought-afflicted state or region. Now, scientists have assessed the global scale of food crop disasters for the first time — and the news is not good.
In a new study, researchers from Canada and the United Kingdom estimate that cereal harvests — including rice, wheat and maize — decreased by an average of 9 to10 percent during droughts and heat waves between 1964 and 2007, with the worst effects seen in North America, Europe, and Australia and its neighboring islands. Furthermore, the impact has grown larger in recent years. With climate change likely to exacerbate extreme weather and make it more common in the future, the study is perhaps the most comprehensive examination yet of the historic impact of extreme weather on global crop production.
The findings from the new research may help guide agricultural priorities in international disaster risk reduction, as well as adaptation efforts. "We can avoid a worsening food-security situation if we invest in adapting our crops to these extremes immediately, and especially if we step up and make solid commitments to avoid further climate change," saidCorey Lesk, of The Earth Institute at Columbia University and the NASA Goddard Institute for Space Studies in Manhattan and first author of the study.
Lesk and his colleagues found that the average impact of recent droughts — those between 1985 and 2007 — was a 13.7 percent loss, which is 7 percent greater than the 6.7 percent impact during droughts that occurred earlier, between 1964 and 1984. The reasons for this are not clear.
"We found that the average impact of drought disasters on crops has gotten worse," Lesk said. "But it is still debated whether droughts themselves have gotten more severe, so another explanation could be that crops have gotten more susceptible to drought over the decades. That could mean, speculatively, that we're already on the wrong path with regard to adapting our crops to a changing climate.
"The thinking is that, if crop responses to drought have gotten bigger, but there is no clear signal that the droughts have gotten worse, then that supports the alternative explanation that crops themselves have gotten more sensitive," he added. "And if they have gotten more sensitive already, that bodes ill for future crop performance in a world of worse droughts."
The researchers found that production losses due to droughts were associated with a reduction in both harvested area and yields, whereas extreme heat mainly decreased yields.Harvested area refers to the planted cropland area that is harvested in a given year. "It takes time, energy and money to harvest crops from a field, and if crops are severely enough damaged, then farmers may choose not to harvest at all," Lesk said. "You could call this a 'total crop failure,' and it shows up in the data as a drop in harvested area. Yield is the mass of grain harvest per unit area harvested — in other words, the productivity of the crops on an area basis. If a crop fails completely and is not harvested, then it doesn't end up in the yield calculations, so you have to consider both metrics to get a full picture."The scientists concluded that droughts caused partial and total damage to crops, resulting in drops in both yield and harvested area. Heat waves, in contrast, only resulted in yield declines.
Q. What is meaning of the phrase “bodes ill” as used in the passage?
Directions
India’s economy continues to decelerate with the government’s estimate for first-quarter gross domestic product pegging growth at a 13-quarter low of 5.7% in April-June. The reasons for the protracted slowdown — a slide of five straight quarters from 9.1% in March 2016 — are many and varied. But there is little doubt that the demonetisation exercise combined with the uncertainty around the July 1 adoption of the new indirect tax regime served to significantly dampen economic activity. While the GST-related “inventory deaccumulation” that one of the Chief Statisticians referred to may well be reversed in the current quarter as companies across sectors gain comfort with the new tax regime, it is still doubtful whether demand for industrial output is going to attain any meaningful strength. The Reserve Bank of India last month said that its industrial outlook survey had “revealed a waning of optimism in Q2 about demand conditions across parameters and especially on capacity utilisation, profit margins and employment.” A look at the sector-specific trends shows that manufacturing expansion in gross value added (GVA) terms has slackened to a near stall at 1.2%. This, from 5.3% in Q4 of the last fiscal and 10.7% a year earlier, is a far from heartening sign. With capacity utilisation expected to weaken this quarter, according to the RBI, and with surveys suggesting that consumer sentiment has deteriorated steadily in August, the auguries for a demand rebound are far from promising.
While expressing concern about the slower-than-expected expansion, the Finance Minister has acknowledged that the challenge before the government now is to work out both policy and investment measures to boost momentum. One option would be to suspend the fiscal road map for a limited period in order to pump prime the economy through increased capital spending by the government. The risks of fiscal loosening are of course manifold, especially at a juncture when several State governments have either announced or are contemplating large-scale farm loan waivers, which would push up interest rates and crowd out fresh lending. Still, there is a thin sliver of a silver lining in the GDP data. The services sector continues to remain buoyant. Quarterly GVA across this broad swathe that encompasses trade, hotels, transport, communication and broadcasting accelerated to 11.1%, from 6.5% in the fourth quarter, faster than the 8.9% posted in the corresponding period last year. The civil aviation sector saw passenger traffic soaring by 15.6%, and construction activity, a provider of jobs, also ticked up by 2%. The Finance Minister has his task cut out: to find ways to restore momentum before the tailwinds of low inflation and affordable energy prices start reversing direction.
The aim of the passage is
Directions
Read the passage given below and answer the questions that follow.
India’s economy continues to decelerate with the government’s estimate for first-quarter gross domestic product pegging growth at a 13-quarter low of 5.7% in April-June. The reasons for the protracted slowdown — a slide of five straight quarters from 9.1% in March 2016 — are many and varied. But there is little doubt that the demonetisation exercise combined with the uncertainty around the July 1 adoption of the new indirect tax regime served to significantly dampen economic activity. While the GST-related “inventory deaccumulation” that one of the Chief Statisticians referred to may well be reversed in the current quarter as companies across sectors gain comfort with the new tax regime, it is still doubtful whether demand for industrial output is going to attain any meaningful strength. The Reserve Bank of India last month said that its industrial outlook survey had “revealed a waning of optimism in Q2 about demand conditions across parameters and especially on capacity utilisation, profit margins and employment.” A look at the sector-specific trends shows that manufacturing expansion in gross value added (GVA) terms has slackened to a near stall at 1.2%. This, from 5.3% in Q4 of the last fiscal and 10.7% a year earlier, is a far from heartening sign. With capacity utilisation expected to weaken this quarter, according to the RBI, and with surveys suggesting that consumer sentiment has deteriorated steadily in August, the auguries for a demand rebound are far from promising.
While expressing concern about the slower-than-expected expansion, the Finance Minister has acknowledged that the challenge before the government now is to work out both policy and investment measures to boost momentum. One option would be to suspend the fiscal road map for a limited period in order to pump prime the economy through increased capital spending by the government. The risks of fiscal loosening are of course manifold, especially at a juncture when several State governments have either announced or are contemplating large-scale farm loan waivers, which would push up interest rates and crowd out fresh lending. Still, there is a thin sliver of a silver lining in the GDP data. The services sector continues to remain buoyant. Quarterly GVA across this broad swathe that encompasses trade, hotels, transport, communication and broadcasting accelerated to 11.1%, from 6.5% in the fourth quarter, faster than the 8.9% posted in the corresponding period last year. The civil aviation sector saw passenger traffic soaring by 15.6%, and construction activity, a provider of jobs, also ticked up by 2%. The Finance Minister has his task cut out: to find ways to restore momentum before the tailwinds of low inflation and affordable energy prices start reversing direction.
Q. According to the passage, which of the following statements is true about the service sector?
Directions
Read the passage given below and answer the questions that follow.
India’s economy continues to decelerate with the government’s estimate for first-quarter gross domestic product pegging growth at a 13-quarter low of 5.7% in April-June. The reasons for the protracted slowdown — a slide of five straight quarters from 9.1% in March 2016 — are many and varied. But there is little doubt that the demonetisation exercise combined with the uncertainty around the July 1 adoption of the new indirect tax regime served to significantly dampen economic activity. While the GST-related “inventory deaccumulation” that one of the Chief Statisticians referred to may well be reversed in the current quarter as companies across sectors gain comfort with the new tax regime, it is still doubtful whether demand for industrial output is going to attain any meaningful strength. The Reserve Bank of India last month said that its industrial outlook survey had “revealed a waning of optimism in Q2 about demand conditions across parameters and especially on capacity utilisation, profit margins and employment.” A look at the sector-specific trends shows that manufacturing expansion in gross value added (GVA) terms has slackened to a near stall at 1.2%. This, from 5.3% in Q4 of the last fiscal and 10.7% a year earlier, is a far from heartening sign. With capacity utilisation expected to weaken this quarter, according to the RBI, and with surveys suggesting that consumer sentiment has deteriorated steadily in August, the auguries for a demand rebound are far from promising.
While expressing concern about the slower-than-expected expansion, the Finance Minister has acknowledged that the challenge before the government now is to work out both policy and investment measures to boost momentum. One option would be to suspend the fiscal road map for a limited period in order to pump prime the economy through increased capital spending by the government. The risks of fiscal loosening are of course manifold, especially at a juncture when several State governments have either announced or are contemplating large-scale farm loan waivers, which would push up interest rates and crowd out fresh lending. Still, there is a thin sliver of a silver lining in the GDP data. The services sector continues to remain buoyant. Quarterly GVA across this broad swathe that encompasses trade, hotels, transport, communication and broadcasting accelerated to 11.1%, from 6.5% in the fourth quarter, faster than the 8.9% posted in the corresponding period last year. The civil aviation sector saw passenger traffic soaring by 15.6%, and construction activity, a provider of jobs, also ticked up by 2%. The Finance Minister has his task cut out: to find ways to restore momentum before the tailwinds of low inflation and affordable energy prices start reversing direction.
What measure is considered as an option in the passage to boost momentum?
Directions
Read the passage given below and answer the questions that follow.
India’s economy continues to decelerate with the government’s estimate for first-quarter gross domestic product pegging growth at a 13-quarter low of 5.7% in April-June. The reasons for the protracted slowdown — a slide of five straight quarters from 9.1% in March 2016 — are many and varied. But there is little doubt that the demonetisation exercise combined with the uncertainty around the July 1 adoption of the new indirect tax regime served to significantly dampen economic activity. While the GST-related “inventory deaccumulation” that one of the Chief Statisticians referred to may well be reversed in the current quarter as companies across sectors gain comfort with the new tax regime, it is still doubtful whether demand for industrial output is going to attain any meaningful strength. The Reserve Bank of India last month said that its industrial outlook survey had “revealed a waning of optimism in Q2 about demand conditions across parameters and especially on capacity utilisation, profit margins and employment.” A look at the sector-specific trends shows that manufacturing expansion in gross value added (GVA) terms has slackened to a near stall at 1.2%. This, from 5.3% in Q4 of the last fiscal and 10.7% a year earlier, is a far from heartening sign. With capacity utilisation expected to weaken this quarter, according to the RBI, and with surveys suggesting that consumer sentiment has deteriorated steadily in August, the auguries for a demand rebound are far from promising.
While expressing concern about the slower-than-expected expansion, the Finance Minister has acknowledged that the challenge before the government now is to work out both policy and investment measures to boost momentum. One option would be to suspend the fiscal road map for a limited period in order to pump prime the economy through increased capital spending by the government. The risks of fiscal loosening are of course manifold, especially at a juncture when several State governments have either announced or are contemplating large-scale farm loan waivers, which would push up interest rates and crowd out fresh lending. Still, there is a thin sliver of a silver lining in the GDP data. The services sector continues to remain buoyant. Quarterly GVA across this broad swathe that encompasses trade, hotels, transport, communication and broadcasting accelerated to 11.1%, from 6.5% in the fourth quarter, faster than the 8.9% posted in the corresponding period last year. The civil aviation sector saw passenger traffic soaring by 15.6%, and construction activity, a provider of jobs, also ticked up by 2%. The Finance Minister has his task cut out: to find ways to restore momentum before the tailwinds of low inflation and affordable energy prices start reversing direction.
Q. Find the word from the given options which has its meaning most opposite to the word pegging as used in the passage.
Directions
Read the passage given below and answer the questions that follow.
India’s economy continues to decelerate with the government’s estimate for first-quarter gross domestic product pegging growth at a 13-quarter low of 5.7% in April-June. The reasons for the protracted slowdown — a slide of five straight quarters from 9.1% in March 2016 — are many and varied. But there is little doubt that the demonetisation exercise combined with the uncertainty around the July 1 adoption of the new indirect tax regime served to significantly dampen economic activity. While the GST-related “inventory deaccumulation” that one of the Chief Statisticians referred to may well be reversed in the current quarter as companies across sectors gain comfort with the new tax regime, it is still doubtful whether demand for industrial output is going to attain any meaningful strength. The Reserve Bank of India last month said that its industrial outlook survey had “revealed a waning of optimism in Q2 about demand conditions across parameters and especially on capacity utilisation, profit margins and employment.” A look at the sector-specific trends shows that manufacturing expansion in gross value added (GVA) terms has slackened to a near stall at 1.2%. This, from 5.3% in Q4 of the last fiscal and 10.7% a year earlier, is a far from heartening sign. With capacity utilisation expected to weaken this quarter, according to the RBI, and with surveys suggesting that consumer sentiment has deteriorated steadily in August, the auguries for a demand rebound are far from promising.
While expressing concern about the slower-than-expected expansion, the Finance Minister has acknowledged that the challenge before the government now is to work out both policy and investment measures to boost momentum. One option would be to suspend the fiscal road map for a limited period in order to pump prime the economy through increased capital spending by the government. The risks of fiscal loosening are of course manifold, especially at a juncture when several State governments have either announced or are contemplating large-scale farm loan waivers, which would push up interest rates and crowd out fresh lending. Still, there is a thin sliver of a silver lining in the GDP data. The services sector continues to remain buoyant. Quarterly GVA across this broad swathe that encompasses trade, hotels, transport, communication and broadcasting accelerated to 11.1%, from 6.5% in the fourth quarter, faster than the 8.9% posted in the corresponding period last year. The civil aviation sector saw passenger traffic soaring by 15.6%, and construction activity, a provider of jobs, also ticked up by 2%. The Finance Minister has his task cut out: to find ways to restore momentum before the tailwinds of low inflation and affordable energy prices start reversing direction.
Q. Find the word from the given options which has its meaning most similar to the word protracted as used in the passage.
Top Courses for Banking Exams


Important Questions for NABARD Practice Test - 5
NABARD Practice Test - 5 MCQs with Answers
Online Tests for NABARD Practice Test - 5
|
© EduRev
|
Education Revolution
|


|


