GMAT Exam  >  GMAT Tests  >  Test: Graph Interpretation- 2 - GMAT MCQ

Test: Graph Interpretation- 2 - GMAT MCQ


Test Description

10 Questions MCQ Test - Test: Graph Interpretation- 2

Test: Graph Interpretation- 2 for GMAT 2024 is part of GMAT preparation. The Test: Graph Interpretation- 2 questions and answers have been prepared according to the GMAT exam syllabus.The Test: Graph Interpretation- 2 MCQs are made for GMAT 2024 Exam. Find important definitions, questions, notes, meanings, examples, exercises, MCQs and online tests for Test: Graph Interpretation- 2 below.
Solutions of Test: Graph Interpretation- 2 questions in English are available as part of our course for GMAT & Test: Graph Interpretation- 2 solutions in Hindi for GMAT course. Download more important topics, notes, lectures and mock test series for GMAT Exam by signing up for free. Attempt Test: Graph Interpretation- 2 | 10 questions in 20 minutes | Mock test for GMAT preparation | Free important questions MCQ to study for GMAT Exam | Download free PDF with solutions
Test: Graph Interpretation- 2 - Question 1


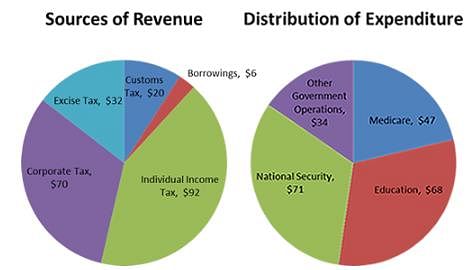
Q. What percentage of total Revenues was collected through Excise Taxes?
Detailed Solution for Test: Graph Interpretation- 2 - Question 1

(B ) 14.54%

Total Revenues = $ (70+32+20+6+92) Billion = $ 220 Billion
Part of Revenue collected from Excise Tax = $32 Billion
Percentage of Revenue collected from Excise Tax = 32/220×100 = 14.54%

Test: Graph Interpretation- 2 - Question 2


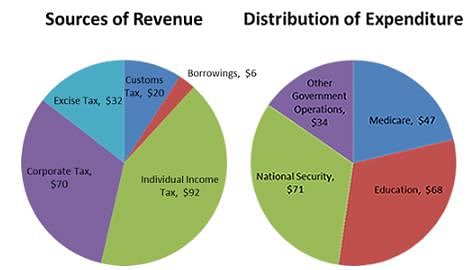
Q. What will be the percentage of expenditures on National Security of the total expenditures if the Government of France also tried to save money of $6 Billion in that year by keeping all the other expenditures and sources of revenues the same?
Detailed Solution for Test: Graph Interpretation- 2 - Question 2

(A ) 30.37%

Total Expenditures as given in the figure = $(34+71+47+68) Billion = $220 Billion

Savings = Revenues – Expenditures
6 = 220 – Expenditures
Expenditures = 220 – 6 = 214
Hence, the expenditures must be decreased by $6 Billion in the National Security because all the other Expenditures are the same.

So, Reduced expenditures of National Security = 71-6 = $65 Billion

Percentage of Reduced expenditures of National Security = 65/214×100 = 30.37 %

1 Crore+ students have signed up on EduRev. Have you? Download the App
Test: Graph Interpretation- 2 - Question 3

Refer to the pictograph of a survey of people in a restaurant whether they like Chinese or Italian food.
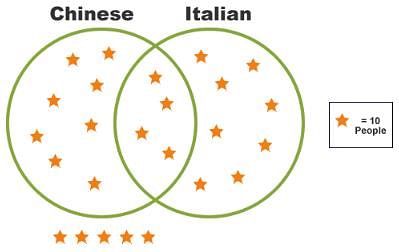
If one person is chosen at random, what is the probability that the person likes both Chinese and Italian?

Detailed Solution for Test: Graph Interpretation- 2 - Question 3

The common region contains 40 people and the total number of people is 250 → 40/250 → 4/25

Test: Graph Interpretation- 2 - Question 4

Refer to the pictograph of a survey of people in a restaurant whether they like Chinese or Italian food.
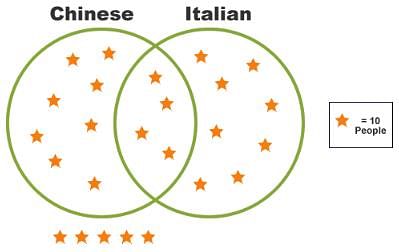

Q. If you want to open a new restaurant, what will be your choice based on the behavior of people shown by the given data?

Detailed Solution for Test: Graph Interpretation- 2 - Question 4

Either one Both have the same probability, so either one can be chosen.

Test: Graph Interpretation- 2 - Question 5

The following Venn-Diagram shows the number of students taking the classes of Physics, Chemistry and Math. Analyzing the figure shown, answer the following questions.
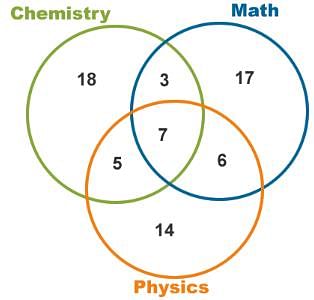

Q. What is the probability that a student is taking two subjects?

Detailed Solution for Test: Graph Interpretation- 2 - Question 5


Total number of students = 18+3+17+5+7+6+14 = 70
Number of students taking two subjects = 3+5+7+6 = 21
Probability of student taking two subjects = 21/70 = 0.2957 = 0.3

Test: Graph Interpretation- 2 - Question 6

The following Venn-Diagram shows the number of students taking the classes of Physics, Chemistry and Math. Analyzing the figure shown, answer the following questions.
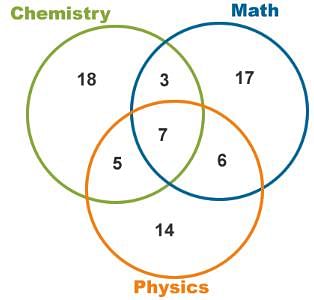

Q. If we double the number of students in the category of Math keeping the same number of students in the other categories, what will be the effect on the probability of students taking Chemistry?

Detailed Solution for Test: Graph Interpretation- 2 - Question 6

(B ) Decreases

Current number of students in Mathematics = 17+3+7+6 = 33
After doubling the number of students in Mathematics = 2×33 = 66
Current total number of students in all the subjects = 70
After doubling the number of student in Mathematics, total students = 70+33 = 103
Number of students in Chemistry = 18+3+7+5 = 33
Current probability of students taking Chemistry = 33/70 = 0.47
After doubling the students in Mathematics, probability of students taking Chemistry = 33/103 = 0.32
So, the probability of students taking Chemistry will decrease.

Test: Graph Interpretation- 2 - Question 7

The following figure shows the day by day earnings of two different organizations (i.e., A and B) in a week. The vertical line is showing the amount earned in dollars and the horizontal line is showing the days of the week. Analyzing the graph shown below answer the questions given.
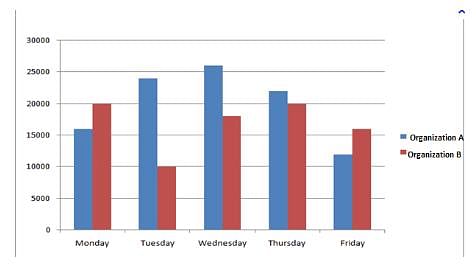

Q. Throughout the week, ________  was more successful.

Detailed Solution for Test: Graph Interpretation- 2 - Question 7

Organization A

Organization A was more successful throughout the week as the amount of money earned by organization A on all the days, except Monday and Friday, are higher than that of organization B by much larger values.

Test: Graph Interpretation- 2 - Question 8

The following figure shows the day by day earnings of two different organizations (i.e., A and B) in a week. The vertical line is showing the amount earned in dollars and the horizontal line is showing the days of the week. Analyzing the graph shown below answer the questions given.
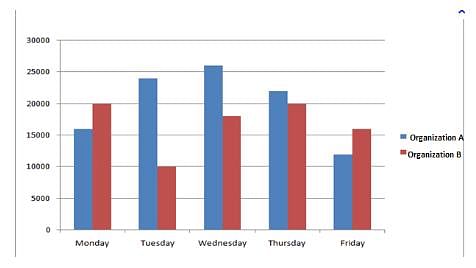

Q. Considering the trends in days Monday, Tuesday and Friday,_______  was the lower earner?

Detailed Solution for Test: Graph Interpretation- 2 - Question 8

Organization B


On Monday, organization A earned about $16000 and organization B earned about $20,000. On Tuesday, Organization A earned about $26,000 and organization B earned about $10,000. On Friday, Organization A earned about $12,000 and organization B earned about $16,000. So the total amount of money earned by Organization A (i.e., $54000) is higher than that of organization B (i.e., $46000).

Test: Graph Interpretation- 2 - Question 9

The total marks of five different subjects of a Grade 8 student are 460. The total marks of each subject are given as the percentage of the total marks i.e. 460. The following chart is showing the percentage of marks of each subject. Analyze the chart below and answer the following questions.
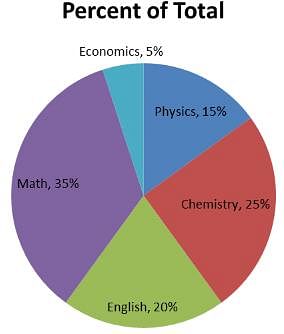

Q. If 40 percent are the passing marks for the subject of Chemistry, then _______ marks are required by a student to pass Chemistry. 

Detailed Solution for Test: Graph Interpretation- 2 - Question 9

(C ) 46

Total marks = 450
Total marks for Chemistry = 25% of 450 = 115
Passing limit for Chemistry = 40%
40% of 115 = 46
Hence, the student must get 46 marks to pass the subject Chemistry.

Test: Graph Interpretation- 2 - Question 10


Q. A new subject is added to the curriculum of Grade 8 such that the weight of marks for Math, English and Economics remain the same but the marks for Chemistry and Physics are reduced by 23. What will the percentage of marks of the new subject be?

Detailed Solution for Test: Graph Interpretation- 2 - Question 10

(B ) 10%

Current percent for Chemistry = 25%
25% of 460 = 115
Reducing marks by 23 will give = 115 – 23 = 92
92 of 460 = (92/460)×100 = 20%
So, percentage of Chemistry has been reduced by 5%.
In the same way, current percentage for Physics = 15%
15% of 460 = 69
Reducing marks by 23 will give = 69 – 23 = 46
46 of 460 = (46/460)×100 = 10%
So, percentage of Physics has also been reduced by 5%.
Hence, the percentage for new subject will be 5%+5% = 10%

Information about Test: Graph Interpretation- 2 Page
In this test you can find the Exam questions for Test: Graph Interpretation- 2 solved & explained in the simplest way possible. Besides giving Questions and answers for Test: Graph Interpretation- 2, EduRev gives you an ample number of Online tests for practice

Top Courses for GMAT

Download as PDF

Top Courses for GMAT