Olympiad Test: Pictorial Representation Of Data - 1 - Class 4 MCQ
10 Questions MCQ Test - Olympiad Test: Pictorial Representation Of Data - 1
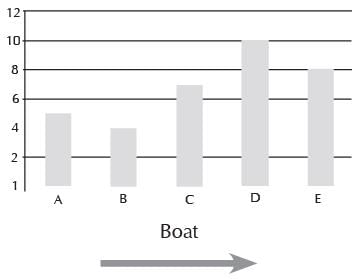
Direction: A boat takes visitors out into the sea to watch dolphins swimming. The bar chart shows the number of people that went out on each boat. Read the chart below and answer the questions that follow :

If Boat A : 5 :: Boat D : ?

If Boat A : 5 :: Boat D : ?
Direction: A boat takes visitors out into the sea to watch dolphins swimming. The bar chart shows the number of people that went out on each boat. Read the chart below and answer the questions that follow :

Find the odd one out.

Find the odd one out.
| 1 Crore+ students have signed up on EduRev. Have you? Download the App |
Direction: A boat takes visitors out into the sea to watch dolphins swimming. The bar chart shows the number of people that went out on each boat. Read the chart below and answer the questions that follow :

How many more people went to boat D then boat A?

How many more people went to boat D then boat A?
Direction: A boat takes visitors out into the sea to watch dolphins swimming. The bar chart shows the number of people that went out on each boat. Read the chart below and answer the questions that follow :

How many less people went on boat C than boat E?
Direction: A boat takes visitors out into the sea to watch dolphins swimming. The bar chart shows the number of people that went out on each boat. Read the chart below and answer the questions that follow :

How many people went all together?
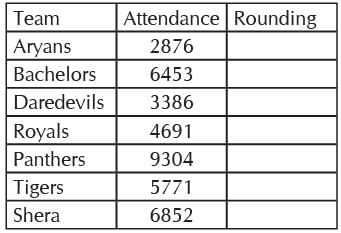
Directions: The table given below shows the number of people watching at various football grounds. Round each number to the nearest thousand and put the answers in right column. Then answers the questions that follow :

Which team was watched by most people?
Directions: The table given below shows the number of people watching at various football grounds. Round each number to the nearest thousand and put the answers in right column. Then answers the questions that follow :

Which team was watched by least people?
Directions: The table given below shows the number of people watching at various football grounds. Round each number to the nearest thousand and put the answers in right column. Then answers the questions that follow :

Find the odd one out.
Directions: The table given below shows the number of people watching at various football grounds. Round each number to the nearest thousand and put the answers in right column. Then answers the questions that follow :

How many less people watched panthers than Aryans (use rounding)?
Directions: The table given below shows the number of people watching at various football grounds. Round each number to the nearest thousand and put the answers in right column. Then answers the questions that follow :

How many less people watched Daredevils than Shera (use rounding)?


