GATE ECE (Electronics) Test: Fourier Analysis of Signals, Energy & Power
MCQ Practice Test & Solutions: Test: Fourier Analysis of Signals, Energy & Power Signals (10 Questions)
You can prepare effectively for Electronics and Communication Engineering (ECE) GATE ECE (Electronics) Mock Test Series 2027 with this dedicated MCQ Practice Test (available with solutions) on the important topic of "Test: Fourier Analysis of Signals, Energy & Power Signals". These 10 questions have been designed by the experts with the latest curriculum of Electronics and Communication Engineering (ECE) 2026, to help you master the concept.
Test Highlights:
- - Format: Multiple Choice Questions (MCQ)
- - Duration: 30 minutes
- - Number of Questions: 10
Sign up on EduRev for free to attempt this test and track your preparation progress.

The signals x1(t) and x2(t) are given by

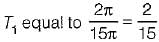
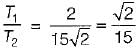
If the periods of x1(t) and x2(t) be T1 and T2 respectively, then T1/T2 is equal to
If the periods of x1(t) and x2(t) be T1 and T2 respectively, then T1/T2 is equal to
Detailed Solution: Question 1

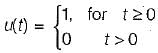
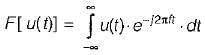
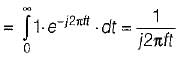
The Fourier transform of a unit step function is
Detailed Solution: Question 2

Assertion (A): A frequency domain representation of a signal shows the frequency content and indicates the shape of the waveform or the combined amplitude of all the input components at any specific time.
Reason (R): In frequency domain, a signal is represented by its frequency spectrum.
Reason (R): In frequency domain, a signal is represented by its frequency spectrum.
Detailed Solution: Question 3
Which of the following option is not correct for obtaining the Fourier transform of a signal x(f)7
Detailed Solution: Question 4
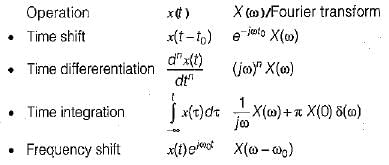
Match List-I (Operations on x(t)) with List-ll (X(ω)/Fourier transform) and select the correct answer using the codes given below the lists:
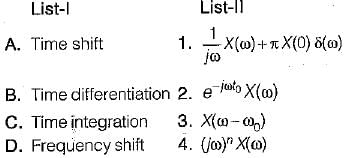
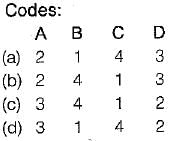
Detailed Solution: Question 5
Assertion (A): The Parseval’s theorem implies superposition of the average powers.
Reason (R): The interpretation of the Parseval’s theorem is that the total average power of the signal x(t) can be found by squaring and adding the heights of the amplitude lines in the spectrum of the periodic signal x(t).
Reason (R): The interpretation of the Parseval’s theorem is that the total average power of the signal x(t) can be found by squaring and adding the heights of the amplitude lines in the spectrum of the periodic signal x(t).
Fourier series analysis is a tool used to
1. analyse any periodic and non-periodic signal.
2. find how many frequency components are present in the signal.
3. find the relative phase difference between various frequency components.
4. represents a waveform in the form of sum of infinite number of exponential terms.
5. find the amplitude of various terms in the series.
Which of the statements given above are correct?
Detailed Solution: Question 7
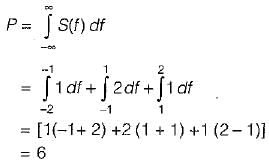
The power spectral density of a power signal x(t) is shown in figure below.
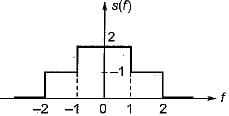
The average power of the signal is
The average power of the signal is
Detailed Solution: Question 8
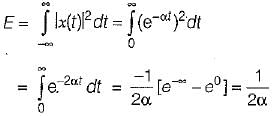
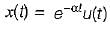
The energy of a causal exponential pulse shown in figure is
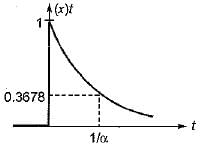
Detailed Solution: Question 9
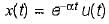
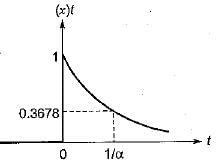
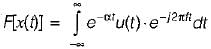
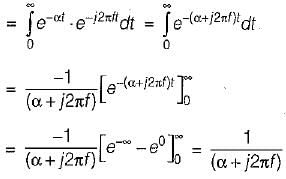
The Fourier transform of the decaying exponential pulse shown in figure is
Detailed Solution: Question 10
 (Time constant,
26 docs|263 tests |