Past Year Questions: PERT And CPM - Mechanical Engineering MCQ
20 Questions MCQ Test - Past Year Questions: PERT And CPM
In PERT, the distribution of activity times is assumed to be
[1995]
A dummy activity is used in PERT network to describe
| 1 Crore+ students have signed up on EduRev. Have you? Download the App |
Consider a PERT network for a project involving six tasks (a to f)
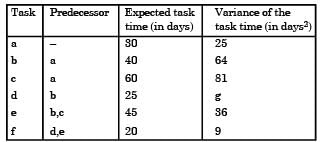
The expected completion time of the project is
[2006]
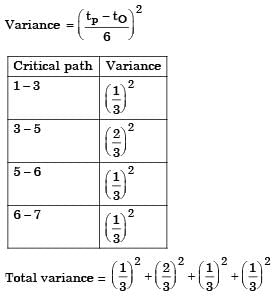
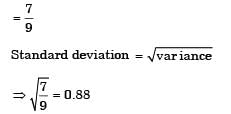
The standard deviation of the critical path of the project is
[2006]
The expected time (te) of a PERT activity in terms of optimistic time (t0), pessimistic time (tp) and most likely time (tl) is given by
[2006]
Consider the following PERT network:
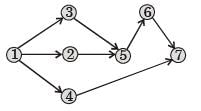
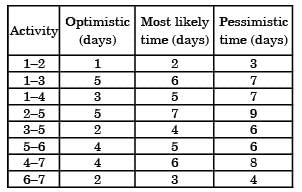
The optimistic time, most likely time and pessimistic time of all the activities are given in the table below:The critical path duration of the network (in days) is
[2009]
The standard deviation of the critical path is
[2009]
In PERT chart, the activity time distribution is
[2016]
In the construction of networks , dummy activities are introduced in order to
[1990]
The symbol used for Transport in work study is
[2003]
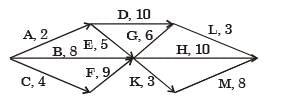
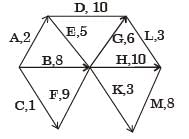
A project consists of activities A to M shown in the net in the following figure with the duration of the activities marked in daysThe project can be completed
[2003]
An assembly activity is represented on an Operation Process Chart by the symbol
[2005]
A project has six activities (A t o F ) w it h respective activity durations 7,5,6,6,8,4 days.The network has three path A-B, C-D and EF. All the activities can be crashed with the same crash cost per day.The number of activities that need to be crashed to reduce the project duration by 1 day is
[2005]
For the network below, the objective is to find the length of the shortest path from node P to node G. Let dij be the length of directed arc from node i to node j.Let sj, be the length of the shortest path from P to node j. Which of the following equations can be used to find SG?
[2008]
The project activities, precedence relationships and durations are described in the table. The critical path of the project is
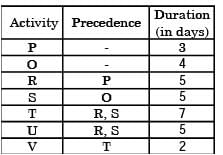
[2010]
If duration of activity f is changed to 10 days, then the critical path for the project is
[2012]
Consider the given project network, where numbers along various activities represent normal time. The free float on activity 4-6 and the project duration, respectively, are
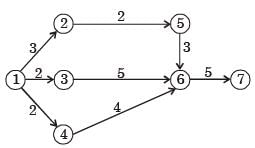
[2014]
The precedence relations and duration (in days) of activities of a project network are given in the table. The total float (in days) of activities e and f, respectively, are
[2014]


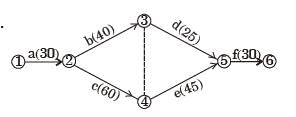 ⇒ a – c – e – f
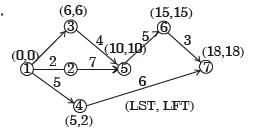
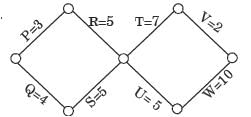 Path QSUW = Q + S + U + W = 4 + 5 + 5 +10 = 24 days.
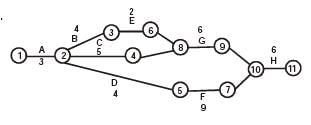 Various path are A B E G H – 17 days A C G H – 16 days A D F H – 18 days; Hence A D F H is critical path
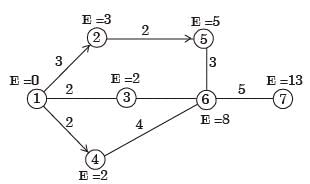 For 4 – 6 Free float = (Ej – Ei) – dij = (8 – 2) – 4
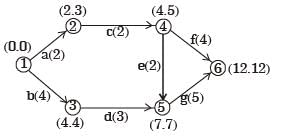 = (E, L)


