Mechanical Engineering Exam  >  Mechanical Engineering Tests  >  Past Year Questions: Production, Planning And Control - Mechanical Engineering MCQ

Past Year Questions: Production, Planning And Control - Mechanical Engineering MCQ


Test Description

16 Questions MCQ Test - Past Year Questions: Production, Planning And Control

Past Year Questions: Production, Planning And Control for Mechanical Engineering 2024 is part of Mechanical Engineering preparation. The Past Year Questions: Production, Planning And Control questions and answers have been prepared according to the Mechanical Engineering exam syllabus.The Past Year Questions: Production, Planning And Control MCQs are made for Mechanical Engineering 2024 Exam. Find important definitions, questions, notes, meanings, examples, exercises, MCQs and online tests for Past Year Questions: Production, Planning And Control below.
Solutions of Past Year Questions: Production, Planning And Control questions in English are available as part of our course for Mechanical Engineering & Past Year Questions: Production, Planning And Control solutions in Hindi for Mechanical Engineering course. Download more important topics, notes, lectures and mock test series for Mechanical Engineering Exam by signing up for free. Attempt Past Year Questions: Production, Planning And Control | 16 questions in 20 minutes | Mock test for Mechanical Engineering preparation | Free important questions MCQ to study for Mechanical Engineering Exam | Download free PDF with solutions
Past Year Questions: Production, Planning And Control - Question 1

The manufacturing area of a plant is divided into four quadrants. Four machines have to located one in each quadrant. The total number of possible layouts is

[1995]

Past Year Questions: Production, Planning And Control - Question 2

Production flow analysis (PFA) is a method of identifying part families that uses data from

[2001]

Detailed Solution for Past Year Questions: Production, Planning And Control - Question 2

 Production flow analysis ( P F A ) i s a comprehensive method for material analysis part family formations, design of manufacturing cell & facility layout design.These operation are taken from the Route sheet.

1 Crore+ students have signed up on EduRev. Have you? Download the App
Past Year Questions: Production, Planning And Control - Question 3

Two machines of the same production rate are available for use. On machine 1, the fixed cost is Rs. 100 and the variable cost is Rs. 2 per piece produced. The corresponding numbers for the machine are Rs. 200 and Rs. 1 respectively.For certain strategic reasons both the machines are to be used concurrently. The sale price of the first 800 units is Rs. 3.50 per unit & and subsequently it is only Rs. 3.00. The breakeven production rate for each machine is

[2003]

Detailed Solution for Past Year Questions: Production, Planning And Control - Question 3

For Machine M1: Fixed cost = Rs 100 Variable cost = Rs 2 per piece For Machine M2: Fixed cost = Rs 200 Variable cost = 1 Rs per piece Total cost = Fixed cost + Variable cost × Number of units.

 100 + 2n + 200 + n = 300 + 2n For the first 300 units, selling price is 3.50 Rs per unit.
So the break even point
300 + 3n = 3.50 (n+n)
300 + 3n = 3.50 (2 n)
7n = 300 + 3n = n = 75.

Past Year Questions: Production, Planning And Control - Question 4

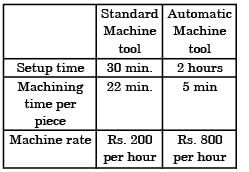
A standard machine tool and an automatic machine tool are being compared for the production of a component. Following data refers to the two machines.​The breakeven production batch size above which the automatic machine tool will be economical to use, will be

[2004]

Detailed Solution for Past Year Questions: Production, Planning And Control - Question 4

Given data

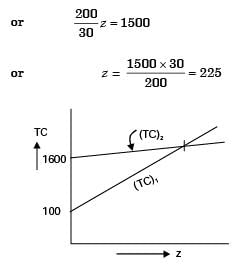
Total cost of z1 component by using standard machine tool,
Total cost of z2 component by using Automatic Machine tool,
Let break even point be z number of components

Past Year Questions: Production, Planning And Control - Question 5

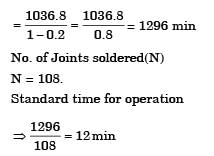
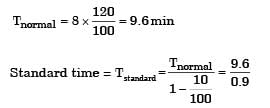
A soldering operation was work-sampled over two days (16 hours) during which an employee soldered 108 joints, actual working time was 90% of the total time and the performance rating was estimated to be 120 percent. If the contract provides allowance of 20 percent of the total time available, the standard time for the operation would be

[2004]

Detailed Solution for Past Year Questions: Production, Planning And Control - Question 5

Total time = 16 hours
T = 16 × 60 = 960 min

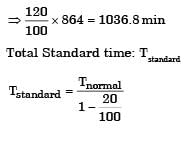
= 864 minute Normal time T normal = 120% of 864

Past Year Questions: Production, Planning And Control - Question 6

An electronic equipment manufacturer has decided to add a component subassembly operation that can produce 80 units during a regular 8-hour shift.This operation consists of three activities as below​For line balancing the number of work stations required for the activities M, E and T would respectively be

[2004]

Detailed Solution for Past Year Questions: Production, Planning And Control - Question 6


Number of units produce in a day = so units working hour in a day = 8 hours
T = 6 min
Number of work station are the whole number more the function.
So no of work station required for the activities, M, E & T would be 2, 3, 4, 1 9. Normal time = Actual Time × Rating factor.

Past Year Questions: Production, Planning And Control - Question 7

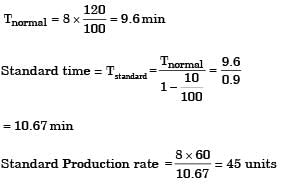
A welding operation is time-studied during which an operator was pace-rated as 120%. The operator took, on an average, 8 minutes for producing the weld-joint. If a total of 10% allowances are at lowed for this operation. The expected standard production rate of the weldjoint (in units per 8 hour day) is

[2005]

Detailed Solution for Past Year Questions: Production, Planning And Control - Question 7

Normal time = Actual Time × Rating factor.
Standard Production rate = 

Past Year Questions: Production, Planning And Control - Question 8

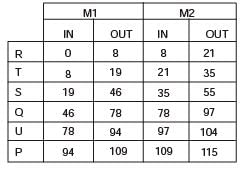
A manufacturing shop processes sheet metal jobs, wherein each job must pass through two machines (M1 and M2, in that order). The processing time (in hours) for these jobs is​The optimal make-span (in hours) of the shop is

[2006]

Detailed Solution for Past Year Questions: Production, Planning And Control - Question 8

Using Johnson’s algorithm

Past Year Questions: Production, Planning And Control - Question 9

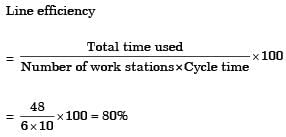
The table gives details of an assembly line.​What is the line efficiency of the assembly line?

[2006]

Detailed Solution for Past Year Questions: Production, Planning And Control - Question 9

Past Year Questions: Production, Planning And Control - Question 10

Capacities of production of an item over 3 consecutive months in regular time are 100,100 and 80 and in overtime are 20, 20 and 40. The demands over those 3 months are 90, 130 and 110. The cost of production in regular time and overtime are respectively Rs. 20 per item and Rs. 24 per item. Inventory carrying cost is Rs. 2 per item month. The levels of starting and final inventory are nil. Backorder is not permitted. For minimum cost of plan, the level of planned production in overtime in the third month is

[2007]

Detailed Solution for Past Year Questions: Production, Planning And Control - Question 10

For minimum total cost the entire regular time production capacity has to be used.
Hence, total over time capacity required = (90 + 130 + 110) – (100+ 100 + 80) = 50
20 Overtime units will be used up in first 2 weeks. Hence 30 overtime units are needed to fulfill the 3rd month demand.

Past Year Questions: Production, Planning And Control - Question 11

The Product structure of an assembly P is shown in the figure.Estimated demand for end product P is as follows:​Ignore lead times for assembly and subassembly. Production capacity (per week) for component R is the bottleneck operation.Starting with zero inventory, the smallest capacity that will ensure a feasible production plan up to week 6 is

[2008]

Detailed Solution for Past Year Questions: Production, Planning And Control - Question 11

The M .R.P. f or R is given by
If 6P – 12800 ≥ 0 then the capacity is f easible \ Minimization ,
6P = 12800⇒
  P ≌ 2200

Past Year Questions: Production, Planning And Control - Question 12

Vehicle manufacturing assembly line is an example of

[2010]

Past Year Questions: Production, Planning And Control - Question 13

The word kanban is most appropriately associated with

[2011 : 1 Mark]

Past Year Questions: Production, Planning And Control - Question 14

Which one of the following is NOT a decision taken during the aggregate production planning stage?

[2012]

Past Year Questions: Production, Planning And Control - Question 15

During the development of a product, an entirely new process plan is made based on design logic, examination of geometry and tolerance information. This type of process planning is known as

[2015]

Past Year Questions: Production, Planning And Control - Question 16

Cylindrical pins of diameter 15±0.020 mm are being produced on a machine. Statistical quality control tests show a mean of 14.995 mm and standard deviation of 0.004 mm. The process capability index Cp is

[2017]

Detailed Solution for Past Year Questions: Production, Planning And Control - Question 16

Diameter of cylindrical Pin = 15 ±.020 Upper Specification limit = 15 + 0.02 = 15.02 mm
Lower Specification limit = 15 – 0.02 = 14.98 mm
Standard deviation (��) = 0.004 mm Process capability Index.

Information about Past Year Questions: Production, Planning And Control Page
In this test you can find the Exam questions for Past Year Questions: Production, Planning And Control solved & explained in the simplest way possible. Besides giving Questions and answers for Past Year Questions: Production, Planning And Control, EduRev gives you an ample number of Online tests for practice

Top Courses for Mechanical Engineering

Download as PDF

Top Courses for Mechanical Engineering