Bar Graphs- 1 - Free MCQ Practice Test with solutions, UPSC
MCQ Practice Test & Solutions: Test: Bar Graphs- 1 (5 Questions)
You can prepare effectively for UPSC CSAT Preparation with this dedicated MCQ Practice Test (available with solutions) on the important topic of "Test: Bar Graphs- 1". These 5 questions have been designed by the experts with the latest curriculum of UPSC 2026, to help you master the concept.
Test Highlights:
- - Format: Multiple Choice Questions (MCQ)
- - Duration: 10 minutes
- - Number of Questions: 5
Sign up on EduRev for free to attempt this test and track your preparation progress.

(Q1-Q5) Directions to solve:
The bar graph given below shows the sales of books (in thousand number) from six branches of a publishing company during two consecutive years 2000 and 2001.
Sales of Books (in thousand numbers) from Six Branches - B1, B2, B3, B4, B5 and B6 of a publishing Company in 2000 and 2001.
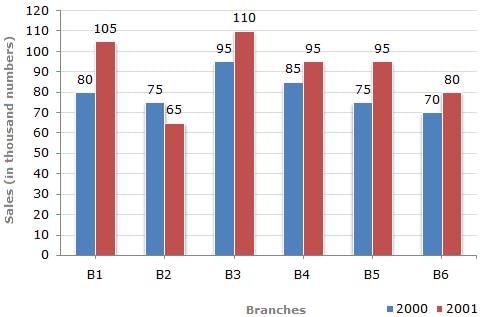
Q. What is the ratio of the total sales of branch B2 for both years to the total sales of branch B4 for both years?
Sales of Books (in thousand numbers) from Six Branches - B1, B2, B3, B4, B5 and B6 of a publishing Company in 2000 and 2001.
Q. What is the ratio of the total sales of branch B2 for both years to the total sales of branch B4 for both years?
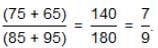
Detailed Solution: Question 1
The bar graph given below shows the sales of books (in thousand number) from six branches of a publishing company during two consecutive years 2000 and 2001.
Sales of Books (in thousand numbers) from Six Branches - B1, B2, B3, B4, B5 and B6 of a publishing Company in 2000 and 2001.

Q. Total sales of branch B6 for both the years is what percent of the total sales of branch B3 for both the years?
Sales of Books (in thousand numbers) from Six Branches - B1, B2, B3, B4, B5 and B6 of a publishing Company in 2000 and 2001.
Q. Total sales of branch B6 for both the years is what percent of the total sales of branch B3 for both the years?
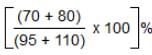
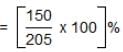
Detailed Solution: Question 2

The bar graph given below shows the sales of books ( in thousand number) from six branches of a publishing company during two consecutive years 2000 and 2001.
Sales of Books (in thousand numbers) from Six Branches - B1, B2, B3, B4, B5 and B6 of a publishing Company in 2000 and 2001.
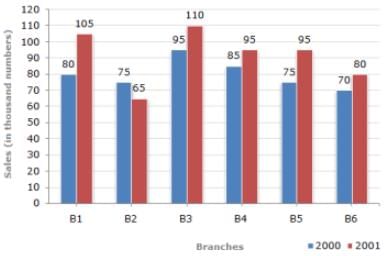
Q. What percent of the average sales of branches B1, B2 and B3 in 2001 is the average sales of branches B1, B3 and B6 in 2000?
Sales of Books (in thousand numbers) from Six Branches - B1, B2, B3, B4, B5 and B6 of a publishing Company in 2000 and 2001.
Q. What percent of the average sales of branches B1, B2 and B3 in 2001 is the average sales of branches B1, B3 and B6 in 2000?
Detailed Solution: Question 3

 = 87.5%
The bar graph given below shows the sales of books (in thousand number) from six branches of a publishing company during two consecutive years 2000 and 2001.
Sales of Books (in thousand numbers) from Six Branches - B1, B2, B3, B4, B5, and B6 of a publishing Company in 2000 amd 2001.

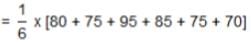
Q. What is the average sales of all the branches (in thousand numbers) for the year 2000?
Sales of Books (in thousand numbers) from Six Branches - B1, B2, B3, B4, B5, and B6 of a publishing Company in 2000 amd 2001.
Q. What is the average sales of all the branches (in thousand numbers) for the year 2000?
Detailed Solution: Question 4
The bar graph given below shows the sales of books (in thousand number) from six branches of a publishing company during two consecutive years 2000 and 2001.
Sales of Books (in thousand numbers) from Six Branches - B1, B2, B3, B4, B5 and B6 of a publishing Company in 2000 and 2001.
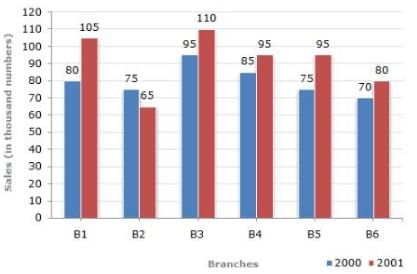
Q. Total sales of branches B1, B3 and B5 together for both the years (in thousand numbers) is
Sales of Books (in thousand numbers) from Six Branches - B1, B2, B3, B4, B5 and B6 of a publishing Company in 2000 and 2001.
Q. Total sales of branches B1, B3 and B5 together for both the years (in thousand numbers) is
Detailed Solution: Question 5
150 videos|303 docs|137 tests |