UPSC Exam  >  UPSC Test  >  CSAT Preparation  >  Test: Bar Graphs- 2 - UPSC MCQ

Bar Graphs- 2 - Free MCQ Practice Test with solutions, UPSC


MCQ Practice Test & Solutions: Test: Bar Graphs- 2 (5 Questions)

You can prepare effectively for UPSC CSAT Preparation with this dedicated MCQ Practice Test (available with solutions) on the important topic of "Test: Bar Graphs- 2". These 5 questions have been designed by the experts with the latest curriculum of UPSC 2026, to help you master the concept.

Test Highlights:

  • - Format: Multiple Choice Questions (MCQ)
  • - Duration: 10 minutes
  • - Number of Questions: 5

Sign up on EduRev for free to attempt this test and track your preparation progress.

Test: Bar Graphs- 2 - Question 1

What was the difference in the number of Q type cars produced in 2000 and that produced in 2001?

Detailed Solution: Question 1

Total number of Q type cars produced in 2001

    = (60 - 40)% of 4,40,000 = 88,000.

Total number of Q type cars produced in 2000

    = (45 - 30)% of 3,50,000 = 52,500.

∴ Required difference = (88000 - 52500) = 35,500.

Test: Bar Graphs- 2 - Question 2

Total number of cars of models P, Q and T manufactured in 2000 is?

Detailed Solution: Question 2

Analysis of the graph:

We shall first determine the number of cars of each model produced by the Company during the two years:

In 2000 : Total number of cars produced = 3,50,000.

  • P = (30 - 0)% of 3,50,000 = 30% of 3,50,000 = 1,05,000.
  • Q = (45 - 30)% of 3,50,000 = 15% of 3,50,000 = 52,500.
  • R = (65 - 45)% of 3,50,000 = 20% of 3,50,000 = 70,000.
  • S = (75 - 65)% of 3,50,000 = 10% of 3,50,000 = 35,000.
  • T = (90 - 75)% of 3,50,000 = 15% of 3,50,000 = 52,500.
  • U = (100 - 90)% of 3,50,000 = 10% of 3,50,000 = 35,000.

In 2001 : Total number of cars produced = 4,40,000.

  • P = (40 - 0)% of 4,40,000 = 40% of 4,40,000 = 1,76,000.
  • Q = (60 - 40)% of 4,40,000 = 20% of 4,40,000 = 88,000.
  • R = (75 - 60)% of 4,40,000 = 15% of 4,40,000 = 66,000.
  • S = (85 - 75)% of 4,40,000 = 10% of 4,40,000 = 44,000.
  • T = (95 - 85)% of 4,40,000 = 10% of 4,40,000 = 44,000.
  • U = (100 - 95)% of 4,40,000 = 5% of 4,40,000 = 22,000.

Total number of cars of models P, Q and T manufacture in 2000
= (105000 + 52500 + 52500)
= 2,10,000.

Test: Bar Graphs- 2 - Question 3

If the percentage production of P type cars in 2001 was the same as that in 2000, then the number of P type cars produced in 2001 would have been?

Detailed Solution: Question 3

If the percentage production of P type cars in 2001

    = Percentage production of P type cars in 2000

    = 30%.

then, number of P type cars produced in 2001

    = 30% of 4,40,000

    = 1,32,000.

Test: Bar Graphs- 2 - Question 4

If 85% of the S type cars produced in each year were sold by the company, how many S type cars remain unsold?

Detailed Solution: Question 4

Number of S type cars which remained unsold in 2000 = 15% of 35,000

and number of S type cars which remained unsold in 2001 = 15% of 44,000.

Therefore Total number of S type cars which remained unsold

    = 15% of (35,000 + 44,000)

    = 15% of 79,000

    = 11,850.

Test: Bar Graphs- 2 - Question 5

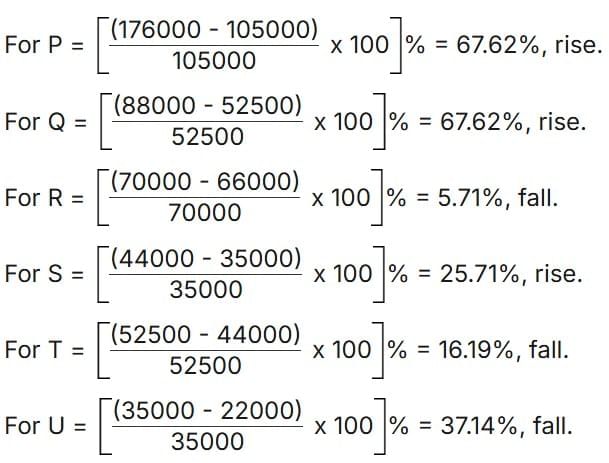
For which model the percentage rise/fall in production from 2000 to 2001 was minimum?

Detailed Solution: Question 5

The percentage change (rise/fall) in production from 2000 to 2001 for various models is:

Therefore Minimum percentage rise/fall is production is the case of model R.

145 videos|299 docs|126 tests
Information about Test: Bar Graphs- 2 Page
In this test you can find the Exam questions for Test: Bar Graphs- 2 solved & explained in the simplest way possible. Besides giving Questions and answers for Test: Bar Graphs- 2, EduRev gives you an ample number of Online tests for practice
145 videos|299 docs|126 tests
Download as PDF