CBSE Class 8  >  Class 8 Test  >  Mathematics (Maths)   >  Test: Data Handling- 1 - Class 8 MCQ

Data Handling- 1 - Free MCQ Practice Test with solutions, Class 8 Maths


MCQ Practice Test & Solutions: Test: Data Handling- 1 (10 Questions)

You can prepare effectively for Class 8 Mathematics (Maths) Class 8 with this dedicated MCQ Practice Test (available with solutions) on the important topic of "Test: Data Handling- 1". These 10 questions have been designed by the experts with the latest curriculum of Class 8 2026, to help you master the concept.

Test Highlights:

  • - Format: Multiple Choice Questions (MCQ)
  • - Duration: 10 minutes
  • - Number of Questions: 10

Sign up on EduRev for free to attempt this test and track your preparation progress.

Test: Data Handling- 1 - Question 1

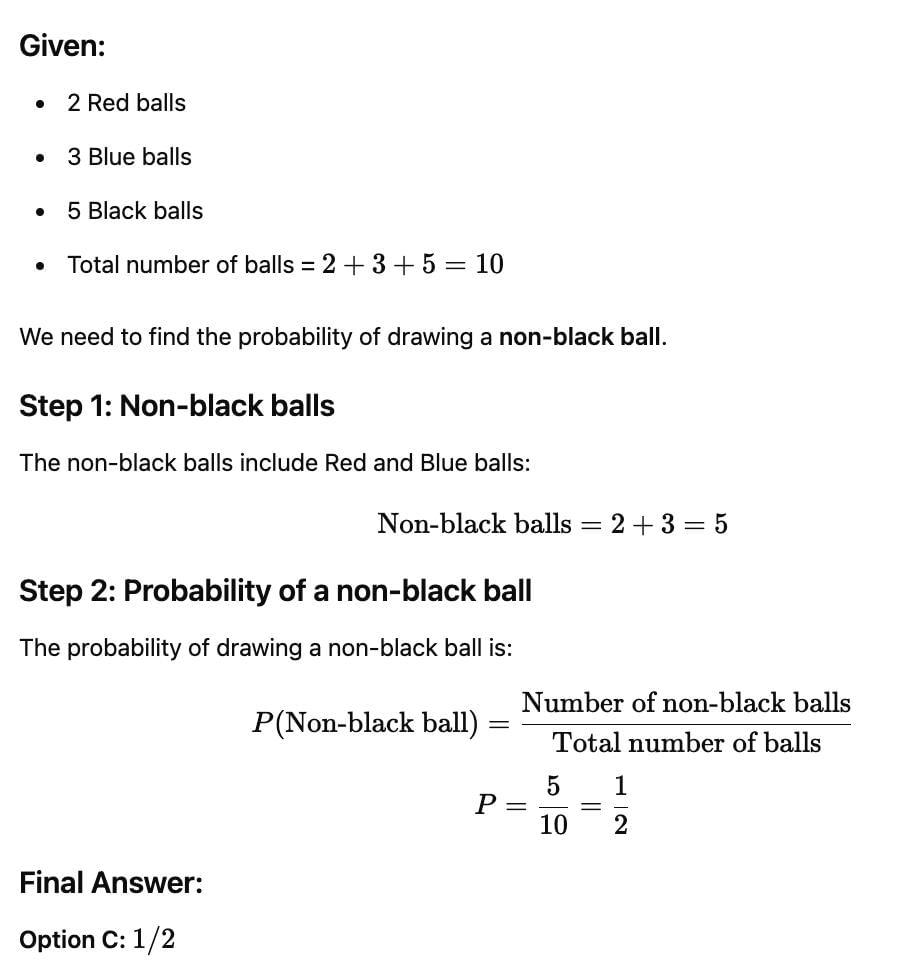
There are 2 Red, 3 Blue and 5 Black balls in a bag. A ball is drawn from the bag without looking in to the bag. What is the probability of getting a non-black ball?

Detailed Solution: Question 1

Test: Data Handling- 1 - Question 2

What is the formula for the probability of an event?

Detailed Solution: Question 2

Test: Data Handling- 1 - Question 3

The pie-chart is divided into

Detailed Solution: Question 3

 A pie chart is a circular chart divided into wedge-like sectors, illustrating proportion. Each wedge represents a proportionate part of the whole, and the total value of the pie is always 100 percent. Pie charts can make the size of portions easy to understand at a glance.

Test: Data Handling- 1 - Question 4

What is an event in probability?

Detailed Solution: Question 4

An event in probability refers to one or more outcomes of an experiment. Here's why option B is correct:

  • An event is a set of possible outcomes from a probability experiment.
  • For example, when rolling a die, an event could be rolling an even number, which includes the outcomes 2, 4, or 6.
  • Events can be simple (a single outcome) or compound (multiple outcomes).
  • Understanding events is crucial for calculating probabilities in various scenarios.

Test: Data Handling- 1 - Question 5

The central total angle in a pie chart is

Detailed Solution: Question 5

The central total angle in a pie chart is:


  • The correct answer is C: 360°.
  • A pie chart represents data in a circular format, where the entire circle makes up 100% of the data.
  • A full circle has an angle of 360 degrees.
  • Each segment or "slice" of the pie chart corresponds to a part of the total 360°.

Test: Data Handling- 1 - Question 6

What does a circle graph represent?

Detailed Solution: Question 6

A circle graph, also known as a pie chart, represents the relationship between a whole and its parts. This type of graph divides a circle into sectors, where each sector's angle is proportional to the quantity it represents relative to the total.

  • The entire circle represents the whole data set.
  • Each sector or slice represents a part of the whole.
  • It is useful for showing percentage or proportional data.
  • Best used when comparing parts of a whole rather than individual data points.

Therefore, the correct answer is C: Relationship between a whole and its part.

Test: Data Handling- 1 - Question 7

18 out of 36 people love reading, so reading in the pie chart will be represented by

Detailed Solution: Question 7

When we find the central angle on pie chart we get 18/36 * 360 =180 degree, which is half of complete angle 360. so people loveing reading can be represented by semi circular 

Test: Data Handling- 1 - Question 8

If the total number of people are 400 then how many of them like tea?

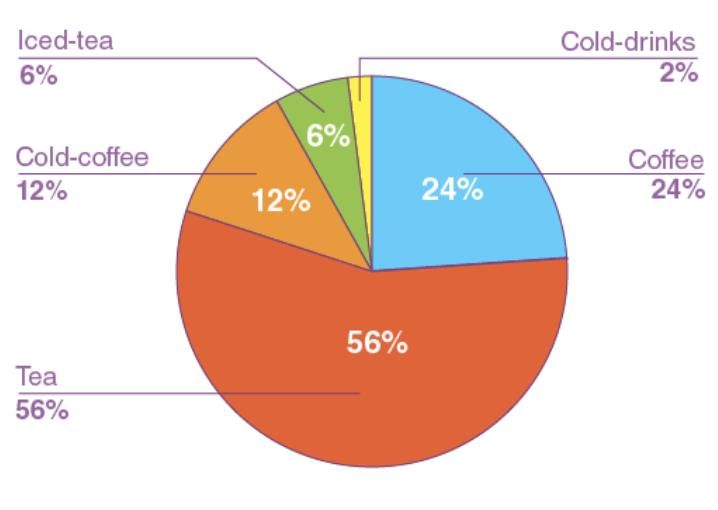
Detailed Solution: Question 8

Total number of people = 400

Number of people like tea = 400 ×  56/100 = 224

Test: Data Handling- 1 - Question 9

What does data handling involve?

Detailed Solution: Question 9

Data handling involves several key processes:

  • Collecting data from various sources.
  • Organizing the data to make it manageable.
  • Analyzing the data to extract meaningful information.
  • Interpreting the data to draw conclusions or make decisions.

Thus, the correct answer is collecting, organizing, analyzing, and interpreting data.

Test: Data Handling- 1 - Question 10

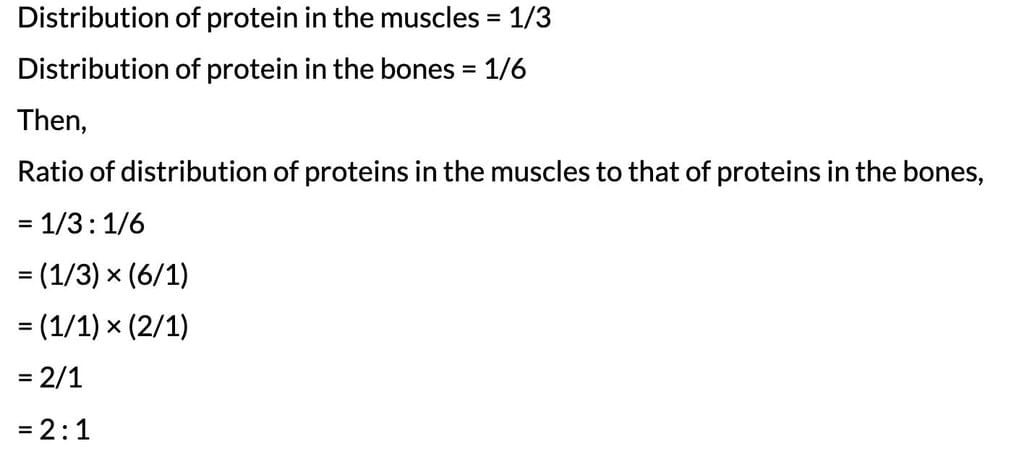
The following pie chart represents the distribution of proteins in parts of a human body. What is the ratio of distribution of proteins in the muscles to that of proteins in the bones?

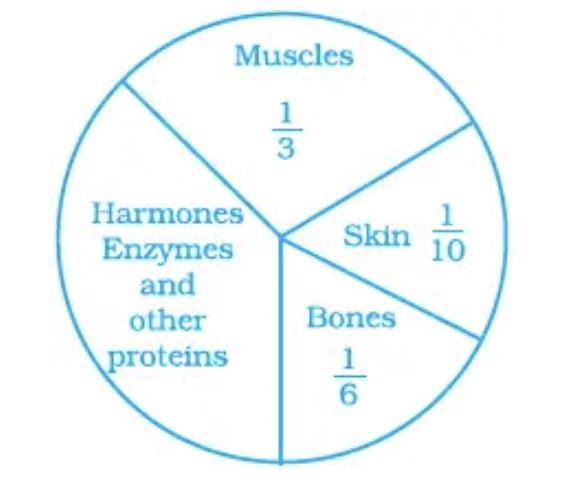
Detailed Solution: Question 10

112 videos|670 docs|49 tests
Information about Test: Data Handling- 1 Page
In this test you can find the Exam questions for Test: Data Handling- 1 solved & explained in the simplest way possible. Besides giving Questions and answers for Test: Data Handling- 1, EduRev gives you an ample number of Online tests for practice
112 videos|670 docs|49 tests
Download as PDF