CBSE Class 5  >  Class 5 Test  >  Mathematics  >  Test: Data Handling - 1 - Class 5 MCQ

Data Handling - 1 - Class 5 Mathematics Free MCQ Test with solutions


MCQ Practice Test & Solutions: Test: Data Handling - 1 (10 Questions)

You can prepare effectively for Class 5 Mathematics for Class 5 with this dedicated MCQ Practice Test (available with solutions) on the important topic of "Test: Data Handling - 1". These 10 questions have been designed by the experts with the latest curriculum of Class 5 2026, to help you master the concept.

Test Highlights:

  • - Format: Multiple Choice Questions (MCQ)
  • - Duration: 10 minutes
  • - Number of Questions: 10

Sign up on EduRev for free to attempt this test and track your preparation progress.

Test: Data Handling - 1 - Question 1

How many children are there whose hobby is adventuring?

Detailed Solution: Question 1

  • As we can see there are three children in the adventure segment
  • each student represents 25 students
  • therefore, 3 × 25 = 75.
  • There are 75 children whose hobby is adventuring.

Test: Data Handling - 1 - Question 2

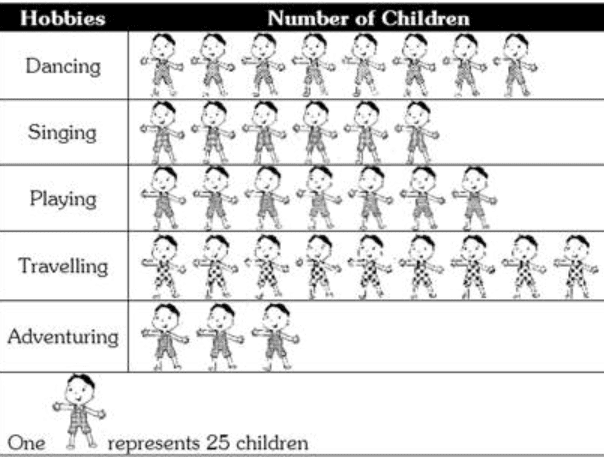
Find the number of children whose hobby is either travelling or adventuring?

Detailed Solution: Question 2

  • Number of children whose hobby is travelling = 9 × 25 = 225
  • Number of children whose hobby is adventuring = 3×25=75
  • Total number of children whose hobby is either travelling or adventuring = 225 + 75 = 300.

Test: Data Handling - 1 - Question 3

In the following question, if > represents 30 people, then how many people visit Sri Lanka?
- Maldives: >>
- Sri Lanka: >>>
- Bangladesh: >
- Malaysia: >>>>

Detailed Solution: Question 3

To find out how many people visit Sri Lanka, follow these steps:

  • Each ">" symbol represents 30 people.
  • Sri Lanka is represented by ">>>".
  • Calculate the total: 3 symbols × 30 people per symbol = 90 people.

Therefore, the number of people visiting Sri Lanka is 90.

Test: Data Handling - 1 - Question 4

If, ↑ represents 5 houses, then the number of houses represented by↑↑↑↑ are:

Detailed Solution: Question 4

Each upward arrow symbolizes 5 houses. Therefore, four arrows represent:

  • 5 multiplied by 4
  • Which equals 20 houses.

Test: Data Handling - 1 - Question 5

A graph drawn using pictures is called:

Detailed Solution: Question 5

A graph that conveys its meaning using pictures is called a pictograph.

A graph drawn using pictures is called

Test: Data Handling - 1 - Question 6

Which graph is best used to represent data that changes over time?

Detailed Solution: Question 6

A bar graph uses rectangular bars to show values for different time periods or categories. When data changes over time in equal intervals, the heights (or lengths) of the bars make it easy to compare and observe trends.

Test: Data Handling - 1 - Question 7

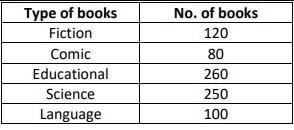
The following table shows the number of books in various categories in a kid’s library. From the table, there are _____ more books in the Fiction category than in the Language category.

Detailed Solution: Question 7

To find how many more books there are in the Fiction category than in the Language category, we can subtract the number of Language books from the number of Fiction books:

120−100=20

There are 20 more books in the Fiction category than in the Language category.

Test: Data Handling - 1 - Question 8

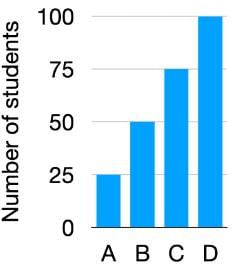
Examine the graph below carefully and answer the following questions. The graph depicts the results of a school’s students.

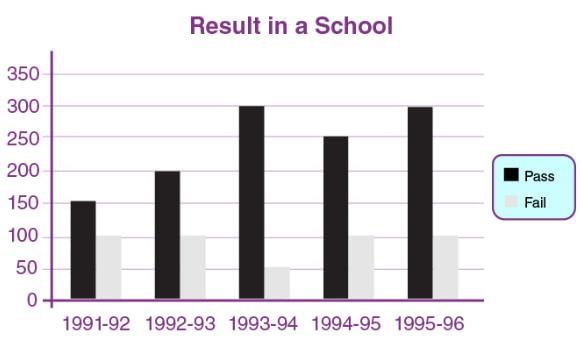
How many times have the same number of kids failed?

Detailed Solution: Question 8

According to visual observation, the number of failed students in 1991-1992, 1992-1993, 1994-1995, and 1995-1996 is the same. As a result, the answer is four.

Test: Data Handling - 1 - Question 9

The bar graph given below shows the sales of books (in thousand number) from six branches of a publishing company during two consecutive years 2000 and 2001.
Sales of Books (in thousand numbers) from Six Branches - B1, B2, B3, B4, B5 and B6 of a publishing Company in 2000 and 2001.

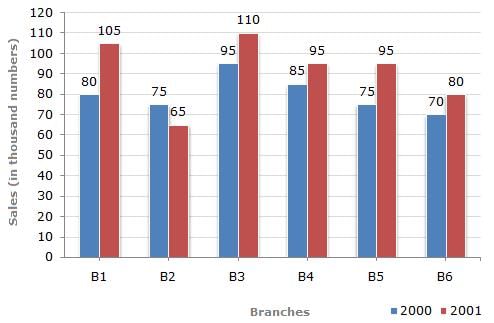
What is the sum of sales of B1 and B5 branches (in thousand numbers) for the year 2000?

Detailed Solution: Question 9

Solution:

  • Sales of branch B1 for the year 2000 = 80 Thousand.
  • Sales of branch B5 for the year 2000 = 75 Thousand .
  • Sum of the sales of B1 and B5 = 80 Thousand + 75 thousand  = 155 Thousand

Test: Data Handling - 1 - Question 10

A graph drawn using rectangular bars is known as ________

Detailed Solution: Question 10

A bar graph is a visual representation of data using rectangular bars, where the height of each bar is proportional to the value it represents. The bars can be arranged vertically or horizontally, and are often used to compare data.

76 videos|469 docs|47 tests
Information about Test: Data Handling - 1 Page
In this test you can find the Exam questions for Test: Data Handling - 1 solved & explained in the simplest way possible. Besides giving Questions and answers for Test: Data Handling - 1, EduRev gives you an ample number of Online tests for practice
76 videos|469 docs|47 tests
Download as PDF