Statistics- Case Based Type Questions - Free with solutions Class 9 Maths
MCQ Practice Test & Solutions: Test: Statistics- Case Based Type Questions (15 Questions)
You can prepare effectively for Class 9 Mathematics (Maths) Class 9 with this dedicated MCQ Practice Test (available with solutions) on the important topic of "Test: Statistics- Case Based Type Questions". These 15 questions have been designed by the experts with the latest curriculum of Class 9 2026, to help you master the concept.
Test Highlights:
- - Format: Multiple Choice Questions (MCQ)
- - Duration: 30 minutes
- - Number of Questions: 15
Sign up on EduRev for free to attempt this test and track your preparation progress.

Direction: Child labour refers to any work or activity that deprives children of their childhood. It is a violation of children's rights. This can harm them mentally or physically. It also exposes them to hazardous situations or stop them from going to school. Naman got data on number of child labours (in million) in different country that is given below.

Q. Which country has the highest child labour?
Detailed Solution: Question 1
Direction: Child labour refers to any work or activity that deprives children of their childhood. It is a violation of children's rights. This can harm them mentally or physically. It also exposes them to hazardous situations or stop them from going to school. Naman got data on number of child labours (in million) in different country that is given below.

Q. Name the country which has 1 million child labour.
Detailed Solution: Question 2

Direction: Child labour refers to any work or activity that deprives children of their childhood. It is a violation of children's rights. This can harm them mentally or physically. It also exposes them to hazardous situations or stop them from going to school. Naman got data on number of child labours (in million) in different country that is given below.

Q. Which country has the lowest child labour?
Detailed Solution: Question 3
Direction: Child labour refers to any work or activity that deprives children of their childhood. It is a violation of children's rights. This can harm them mentally or physically. It also exposes them to hazardous situations or stop them from going to school. Naman got data on number of child labours (in million) in different country that is given below.
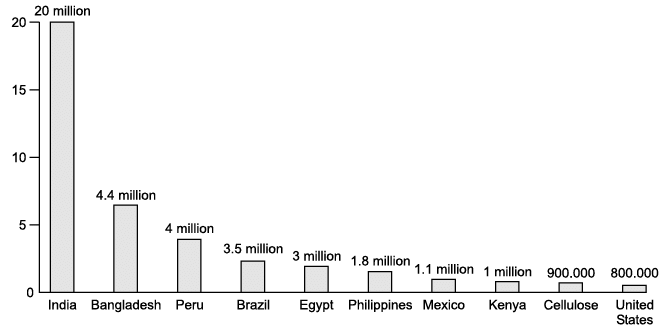
Q. Name the countries having more than 4 million child labour?
Detailed Solution: Question 4
Direction: Child labour refers to any work or activity that deprives children of their childhood. It is a violation of children's rights. This can harm them mentally or physically. It also exposes them to hazardous situations or stop them from going to school. Naman got data on number of child labours (in million) in different country that is given below.

Q. Which country has more than 3 million but less than 6 million child labour?
Detailed Solution: Question 5
Direction: Ladli Scheme was launched by the Delhi Government in the year 2008. This scheme helps to make women strong and will empower a girl child. This scheme was started in 2008.
Read the above bar graph and answer the following questions :

Q. Which statement is incorrect about bar graph?
Detailed Solution: Question 6
Direction: Ladli Scheme was launched by the Delhi Government in the year 2008. This scheme helps to make women strong and will empower a girl child. This scheme was started in 2008.

Read the above bar graph and answer the following questions :

Q. What was the difference in budget in the year 2008 - 09 and 2009 - 10?
Detailed Solution: Question 7
Direction: Ladli Scheme was launched by the Delhi Government in the year 2008. This scheme helps to make women strong and will empower a girl child. This scheme was started in 2008.

Read the above bar graph and answer the following questions :

Q. In which year the budget was minimum?
Detailed Solution: Question 8
Direction: Ladli Scheme was launched by the Delhi Government in the year 2008. This scheme helps to make women strong and will empower a girl child. This scheme was started in 2008.

Q. Read the above bar graph and answer the following questions :

In which year the budget was maximum?
Detailed Solution: Question 9
Direction: Ladli Scheme was launched by the Delhi Government in the year 2008. This scheme helps to make women strong and will empower a girl child. This scheme was started in 2008.

Read the above bar graph and answer the following questions :
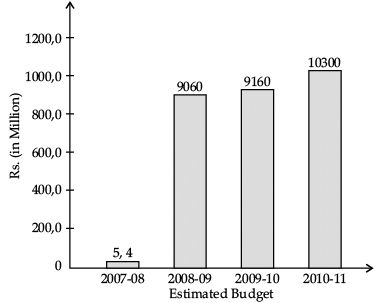
Q. What was the budget in 2010 - 11?
Detailed Solution: Question 10
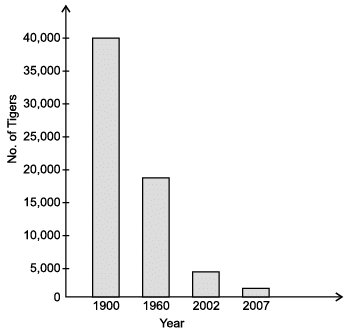
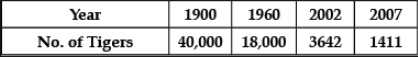
Direction: India's national animal Tiger (which has also been under the radar of the government as its population declined in the country) has witnessed an increase in its population.
A survey was done by the Ministry of Environment, Forests and Climate change, according to which tiger population is on rise at the rate of 6 per cent every year from 2006 and 2018.


Pranav has found a report on status of tigers in India in last 100 years. He has some queries as follow :
Q. In which year, number of tigers were maximum?
Detailed Solution: Question 11
Direction: India's national animal Tiger (which has also been under the radar of the government as its population declined in the country) has witnessed an increase in its population.
A survey was done by the Ministry of Environment, Forests and Climate change, according to which tiger population is on rise at the rate of 6 per cent every year from 2006 and 2018.


Pranav has found a report on status of tigers in India in last 100 years. He has some queries as follow :
Q. In which year, number of tigers were minimum?
Detailed Solution: Question 12
Direction: India's national animal Tiger (which has also been under the radar of the government as its population declined in the country) has witnessed an increase in its population.
A survey was done by the Ministry of Environment, Forests and Climate change, according to which tiger population is on rise at the rate of 6 per cent every year from 2006 and 2018.


Pranav has found a report on status of tigers in India in last 100 years. He has some queries as follow :
Q. What is the total decline in number of tigers between 1960 to 2007?
Detailed Solution: Question 13
Direction: India's national animal Tiger (which has also been under the radar of the government as its population declined in the country) has witnessed an increase in its population.
A survey was done by the Ministry of Environment, Forests and Climate change, according to which tiger population is on rise at the rate of 6 per cent every year from 2006 and 2018.

Pranav has found a report on status of tigers in India in last 100 years. He has some queries as follow :
Q. What does this bar graph show?
Detailed Solution: Question 14
Direction: India's national animal Tiger (which has also been under the radar of the government as its population declined in the country) has witnessed an increase in its population.
A survey was done by the Ministry of Environment, Forests and Climate change, according to which tiger population is on rise at the rate of 6 per cent every year from 2006 and 2018.

Pranav has found a report on status of tigers in India in last 100 years. He has some queries as follow :
Q. How much decrease in number of tigers was there between 1900 and 1960?
Detailed Solution: Question 15
40 videos|468 docs|55 tests |