Case Based Questions Test: Electricity - Class 10 MCQ
10 Questions MCQ Test - Case Based Questions Test: Electricity
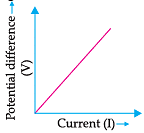
Observe the graph and answer the question. The V-I graph for a conductor is as shown in figure.
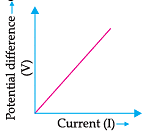
What do you infer from this graph ?

Observe the graph and answer the question. The V-I graph for a conductor is as shown in figure.
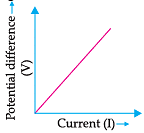
Which of the following law justify the above graph:

| 1 Crore+ students have signed up on EduRev. Have you? Download the App |
Observe the graph and answer the question. The V-I graph for a conductor is as shown in figure.
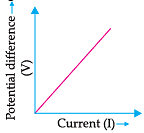
Name the physical quantity represented by the slope of this graph

Observe the graph and answer the question. The V-I graph for a conductor is as shown in figure.
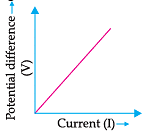
Ohm is the SI unit of:
Observe the graph and answer the question. The V-I graph for a conductor is as shown in figure.
Resistance of a conductor depends on:
Read the passage and answer the questions:
Three resistors of 5 Ω, 10 Ω and 15 Ω are connected in series and the combination is connected to the battery of 30 V. Ammeter and voltmeter are connected in the circuit.
Q. Which of the following is the correct circuit diagram to connect all the devices in proper correct order.
Read the passage and answer the questions:
Three resistors of 5 Ω, 10 Ω and 15 Ω are connected in series and the combination is connected to the battery of 30 V. Ammeter and voltmeter are connected in the circuit.
Q. The device used to measure the current:
Read the passage and answer the questions:
Three resistors of 5 Ω, 10 Ω and 15 Ω are connected in series and the combination is connected to the battery of 30 V. Ammeter and voltmeter are connected in the circuit.
Q. How much is the total resistance?
Read the passage and answer the questions:
Three resistors of 5 Ω, 10 Ω and 15 Ω are connected in series and the combination is connected to the battery of 30 V. Ammeter and voltmeter are connected in the circuit.
Q. Which of the following is connected in series in circuit:
Read the passage and answer the questions:
Three resistors of 5 Ω, 10 Ω and 15 Ω are connected in series and the combination is connected to the battery of 30 V. Ammeter and voltmeter are connected in the circuit.
Q. Two students perform experiments on two given resistors R1 and R2 and plot the following V-I graphs. If R1> R2, which of the diagrams correctly represent the situation on the plotted curves?


