Olympiad Test: Pictographs - 1 - Class 2 MCQ
10 Questions MCQ Test - Olympiad Test: Pictographs - 1
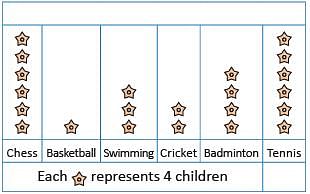
The given graph shows the types of favourite sport of a group of children.
How many children like basketball and chess altogether?

How many children like basketball and chess altogether?

| 1 Crore+ students have signed up on EduRev. Have you? Download the App |
Direction: The given pictograph shows how many toys are owned by children of a locality.

In this pictograph,  represents 5 toys. Now answer the following questions.
What is the difference between the number of toys owned by Rohit and Suresh?

In this pictograph,
 represents 5 toys. Now answer the following questions.
Direction: The given pictograph shows how many toys are owned by children of a locality.

In this pictograph,  represents 5 toys. Now answer the following questions.
How much toys do Gautam need to own to equal the number of toys owned by Rohit?
Direction: Read the following data carefully and choose the best option.

Which class has the minimum number of students?
Direction: Read the following data carefully and choose the best option.

How many students study in Class 3?
Direction: Read the following data carefully and choose the best option.

What is the difference between the number of students of Class 2 and 3?
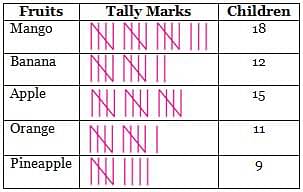
Direction: Following data represents number of children who like each of given fruits. Read the information and choose the correct option.

_______ is liked by 15 children.
Direction: Following data represents number of children who like each of given fruits. Read the information and choose the correct option.

The difference between the number of children who like mango and orange is ________.
Direction: Following data represents number of children who like each of given fruits. Read the information and choose the correct option.

Tally marks are ______ lines.


