Test Level 1: Table - CAT MCQ
20 Questions MCQ Test - Test Level 1: Table

Directions: In the table below, the numbers of students studying in different standards of six different schools are given. Study the table carefully to answer the question that follows.
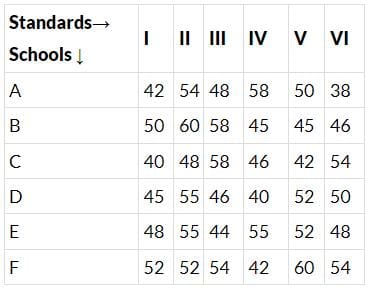
What is the ratio of the total number of students studying in Class III of schools A and B and the total number of students studying in Class VI of schools C and D?
Directions: In the table below, the numbers of students studying in different standards of six different schools are given. Study the table carefully to answer the question that follows.
The number of students studying in standard IV from school E is what percent of that from school D?
| 1 Crore+ students have signed up on EduRev. Have you? Download the App |
Directions: In the table below, the numbers of students studying in different standards of six different schools are given. Study the table carefully to answer the question that follows.
What is the approximate average number of students studying in standard I in all the schools?
Directions: Study the table given below and answer the question that follows.
The given table shows the production of rice and wheat in various parts of a country during 1986 to 1992. All the figures are in '000 tonnes.

The ratio of rice production to wheat production in 1989 is
Directions: Study the table given below and answer the question that follows.
The given table shows the production of rice and wheat in various parts of a country during 1986 to 1992. All the figures are in '000 tonnes.
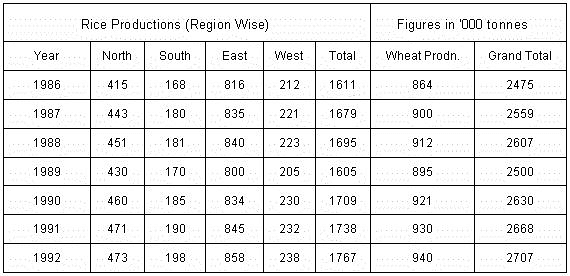
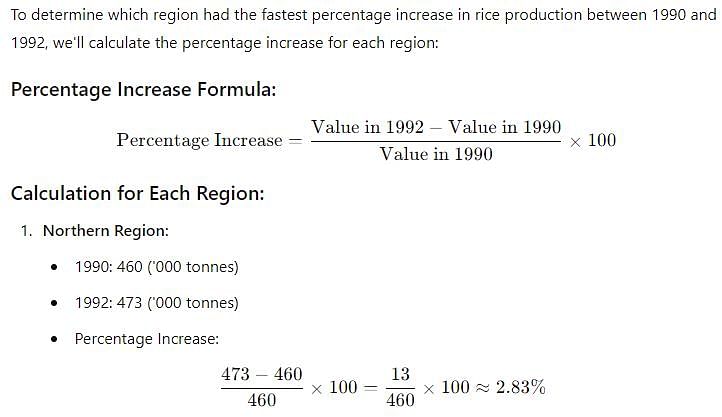
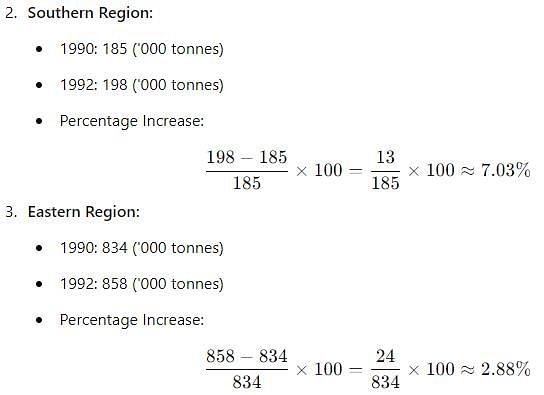
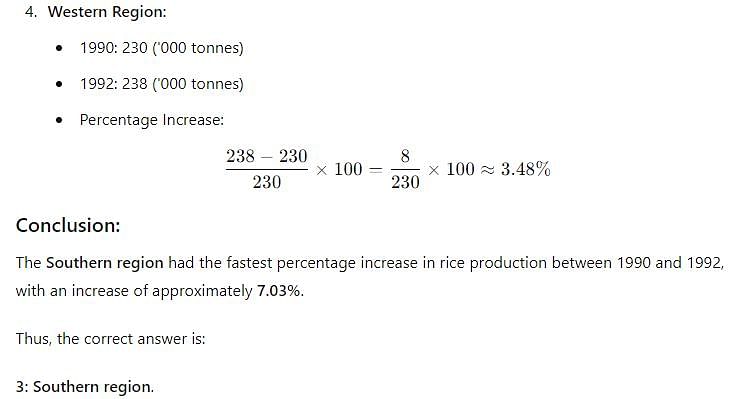
Between 1990-92, the fastest percentage increase in production of rice was in the
Directions: Study the table given below and answer the question that follows.
The given table shows the production of rice and wheat in various parts of a country during 1986 to 1992. All the figures are in '000 tonnes.

From 1986-92, wheat production went up by approximately
Directions: Study the table given below and answer the question that follows.
The given table shows the production of rice and wheat in various parts of a country during 1986 to 1992. All the figures are in '000 tonnes.
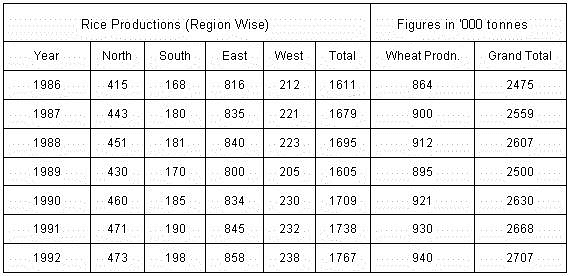
What is the approximate per capita production of rice and wheat in the year 1992? (Population of the country is approximately 900 million.)
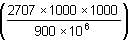 = 3.0 kg
Directions: Study the given data and answer the following question.
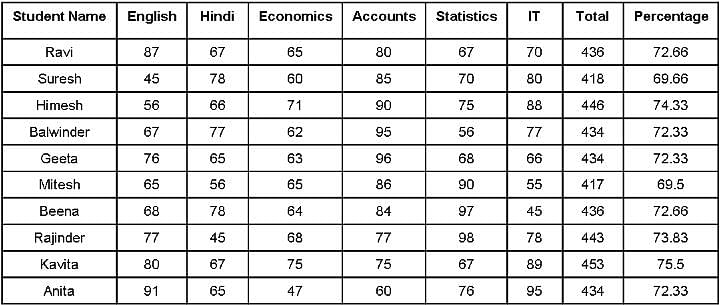
The following table gives marks scored by ten students in different subjects (out of 100):
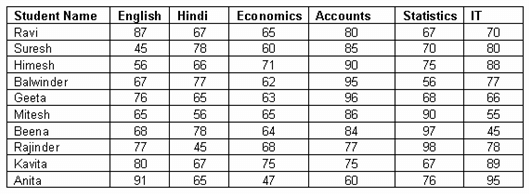
Who ranked first?
Directions: Study the following table carefully to answer the given question.
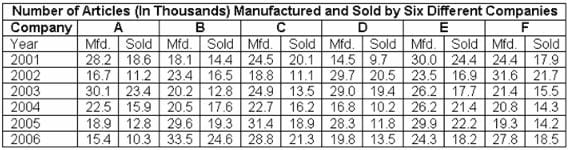
The number of articles sold by company E in the year 2003 is what percent of the number of articles manufactured by it in that year? (Rounded of to two digits after decimal)
Directions: Answer the given question based on the following table:
MARKET SHARES OF 165 LITRES REFRIGERATORS IN 1998-99 (IN THOUSANDS)
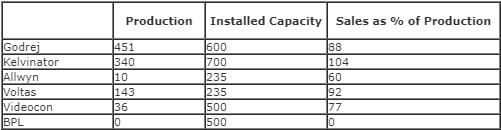
The least number of refrigerators that Kelvinator must have had in stock at the beginning of 1998-99 was
Directions: Answer the given question based on the following table:
MARKET SHARES OF 165 LITRES REFRIGERATORS IN 1998-99 (IN THOUSANDS)

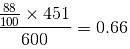
Which company had the highest sales-to-installed capacity ratio in 1998-99?
Directions: Answer the given question based on the following table:
MARKET SHARES OF 165 LITRES REFRIGERATORS IN 1998-99 (IN THOUSANDS)

What is the total approximate sales as a percentage of production in 1998-99 for all companies together?
Directions: Study the given information and answer the following question.
In the table given below, marks obtained by different students in different subjects are listed:
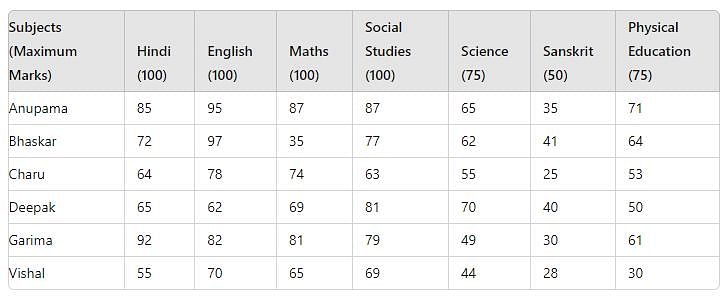
Calculate the average marks obtained by all the students combined in Science.
Directions: Study the given information and answer the following question.
In the table given below, marks obtained by different students in different subjects are listed:

Marks obtained by Charu in Hindi are what percent of the marks (up to two digits after decimal) obtained by Anupama in the same subject?
Directions: Study the given information and answer the following question.
In the table given below, marks obtained by different students in different subjects are listed:

What is the percent of Deepak's marks (up to two digits after decimal) in all the subjects?
Directions: Study the given information and answer the following question.
In the table given below, marks obtained by different students in different subjects are listed:
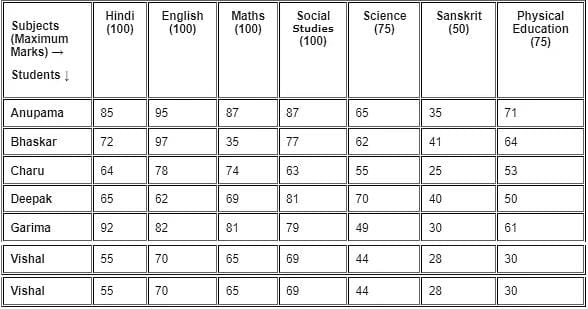
Who scored the highest marks in all the subjects combined?
Directions: Answer the given question based on the following table.
PRODUCTION OF DIFFERENT PRODUCTS OF XYZ CORPORATION:
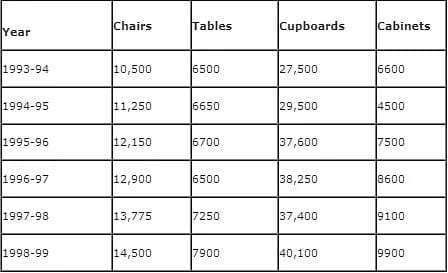
During 1997-98, which of the following products showed a decrease in production in comparison to the previous year?
Directions: Answer the given question based on the following table.
PRODUCTION OF DIFFERENT PRODUCTS OF XYZ CORPORATION:

What was the average production of cabinets from 1993-94 to 1997-98?
Directions: In the table, the numbers of workers working in various factories in various shifts are given. Study the table carefully and answer the question given below.
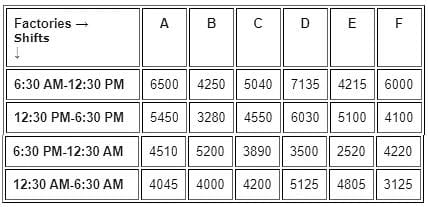
What is the difference between the average number of workers working in factory B and the average number of workers working in factory F?
Directions: In the table, the numbers of workers working in various factories in various shifts are given. Study the table carefully and answer the question given below.
What is the ratio of the total number of workers working in the shift 6:30 AM - 12:30 PM from all the factories together to the total number of workers working in the shift 12:30 AM - 6:30 AM from all the factories together?
Top Courses for CAT


Important Questions for Test Level 1: Table
Test Level 1: Table MCQs with Answers
Online Tests for Test Level 1: Table
|
© EduRev
|
Education Revolution
|


|


