Test Level 2: Pie Chart - CAT MCQ
20 Questions MCQ Test - Test Level 2: Pie Chart

Directions: The question is based on the following pie chart.
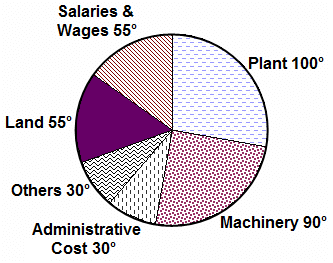
Project implementation cost of ABC Ltd. (Rs. Crores)
Total project cost = Rs. 252 Crores

If the plant cost increases by 5% due to increase in construction cost, what will be approximate angle of the plant sector in the pie chart?
Project implementation cost of ABC Ltd. (Rs. Crores)
Total project cost = Rs. 252 Crores
 = 103.6° (Approx)
Directions: The question is based on the following pie chart.
Project implementation cost of ABC Ltd. (Rs. Crores)
Total project cost = Rs. 252 Crores

If there is an escalation of 10% in Salaries& Wages and a reduction of 10% in land, what will be the new angle of salaries and wages?
Project implementation cost of ABC Ltd. (Rs. Crores)
Total project cost = Rs. 252 Crores
| 1 Crore+ students have signed up on EduRev. Have you? Download the App |
Directions: The question is based on the following pie chart.
Project implementation cost of ABC Ltd. (Rs. Crores)
Total project cost = Rs. 252 Crores
If 5% of administrative costs are reduced and 10% of the remaining administrative costs are transferred to Others category, what is the angle of administrative costs now?
Project implementation cost of ABC Ltd. (Rs. Crores)
Total project cost = Rs. 252 Crores
 x 360 = 25.76°
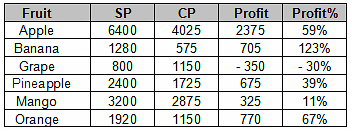
Directions: The following diagrams show the cost price and selling price (in Rs.) of different fruits sold by a fruit vendor.

How much percentage profit can he earn from the apples?
 =
=  × 100 = 59% (approx.)
Directions: The following diagrams show the cost price and selling price (in Rs.) of different fruits sold by a fruit vendor.

On which fruit will he get the highest profit percentage?
Directions: The following diagrams show the cost price and selling price (in Rs.) of different fruits sold by a fruit vendor.

On how many types of fruits will he suffer a loss?

Directions: The following diagrams show the cost price and selling price (in Rs.) of different fruits sold by a fruit vendor.
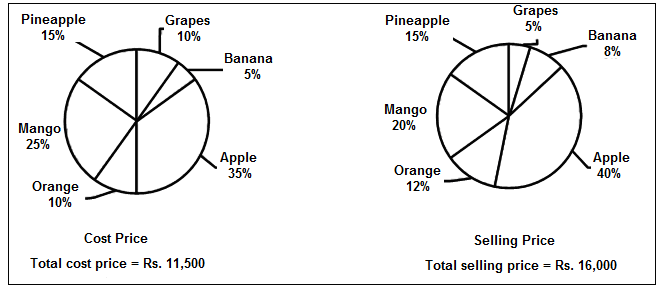
If the selling price of pineapple is increased by 20%, then what is the percentage increase in the total selling price?
Directions: Answer the question on the basis of the pie charts given below.
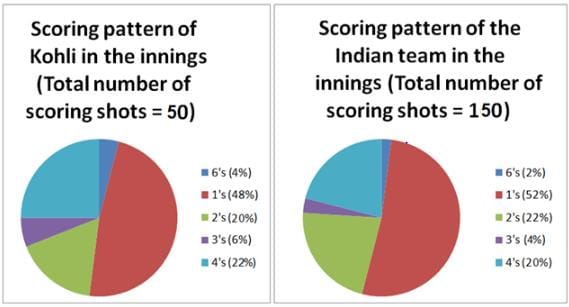
The following pie charts show the distribution of run scored by Kohli and the Indian team in an innings, considering only the scoring shots.

- The balls on which no runs were scored are called dot balls.
- Strike rate of a batsman is the number of runs scored as the percentage of the total number of balls played, including the dot balls.
If Kohli played 98 dot balls, what was his approximate strike rate?
 = 73.65 = 74 (approx.)
Directions: Answer the question on the basis of the pie charts given below.
The following pie charts show the distribution of run scored by Kohli and the Indian team in an innings, considering only the scoring shots.
- The balls on which no runs were scored are called dot balls.
- Strike rate of a batsman is the number of runs scored as the percentage of the total number of balls played, including the dot balls.
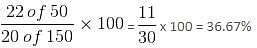
What was Kohli's share in the number of 4s scored by the Indian team?
Directions: Answer the question on the basis of the pie charts given below.
The following pie charts show the distribution of run scored by Kohli and the Indian team in an innings, considering only the scoring shots.

- The balls on which no runs were scored are called dot balls.
- Strike rate of a batsman is the number of runs scored as the percentage of the total number of balls played, including the dot balls.
If the strike rate of the Indian team for this innings was 75%, how many dot balls were played?
Directions: Answer the question on the basis of the pie charts given below.
The following pie charts show the distribution of run scored by Kohli and the Indian team in an innings, considering only the scoring shots.

- The balls on which no runs were scored are called dot balls.
- Strike rate of a batsman is the number of runs scored as the percentage of the total number of balls played, including the dot balls.
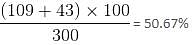
If Dhoni scored 43 runs in the innings, how much did Dhoni and Kohli together contribute to the team's total score?
Directions: Study the following information of monthly income and expenditure of an NGO and answer the question.
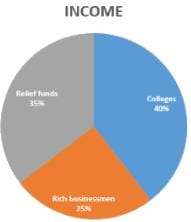
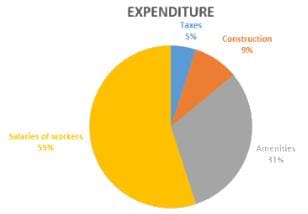
If the income from colleges is Rs. 40 lakhs and expenditure on salaries of workers is Rs. 11 lakhs, then find the savings of an NGO.
(Saving = Income - Expenditure)
Directions: Study the following information of monthly income and expenditure of an NGO and answer the question.
If no money is spent on construction, then the income and expenditure are same; otherwise there is shortage of Rs. 6,50,000. What is the total income (approximately) of the NGO?
Directions: Study the following information of monthly income and expenditure of an NGO and answer the question.
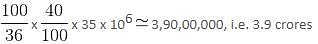
If the total income was Rs. 3.5 crores, and expenses on taxes and amenities is done only from the total colleges income, then what is the total expenditure (approximately)?
Directions: Study the following information of monthly income and expenditure of an NGO and answer the question.
If relief funds's contribution was Rs. 10,00,000 and total savings were Rs. 60,000, then what would be the expenditure on salaries of workers?
(Savings = Income - Expenditure)
 28,57,143
Directions: Study the given information and answer the following question.
The pie charts shown below give information about the percentage distribution of incomes and expenses of different family members.

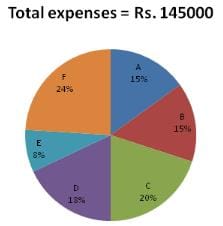
If the income of F increases by 18% and his expenses increase by 36%, then what will be the percentage decrease in savings of F?
Directions: Study the given information and answer the following question.
The pie charts shown below give information about the percentage distribution of incomes and expenses of different family members.
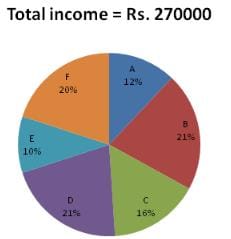

The amount saved by B is what percent of amount saved by D?
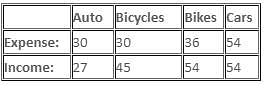
Directions: A company manufactures bicycles, bikes, cars and auto rickshaws. In the previous year, this company got 20% profit.
The following pie-charts represent the expenses and income of the company last year.
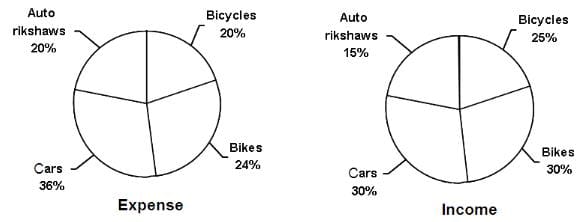
Total expenses are $150 mn.
Which product gave the maximum profit percentage?

Directions: A company manufactures bicycles, bikes, cars and auto rickshaws. In the previous year, this company got 20% profit.
The following pie-charts represent the expenses and income of the company last year.
Total expenses are $150 mn.
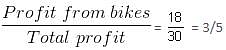
What is the ratio of profit from bikes to the total profit?

Directions: A company manufactures bicycles, bikes, cars and auto rickshaws. In the previous year, this company got 20% profit.
The following pie-charts represent the expenses and income of the company last year.
Total expenses are $150 mn.
If expenses of cars increase by 10% and income on bikes decreases by 10% and others do not change, then what is the percentage change in the total profit?
Top Courses for CAT


Important Questions for Test Level 2: Pie Chart
Test Level 2: Pie Chart MCQs with Answers
Online Tests for Test Level 2: Pie Chart
|
© EduRev
|
Education Revolution
|


Follow Us
|


