Test Level 2: Bar Graph - CAT MCQ
20 Questions MCQ Test - Test Level 2: Bar Graph

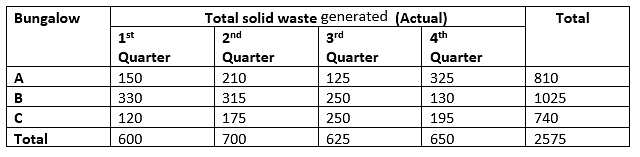
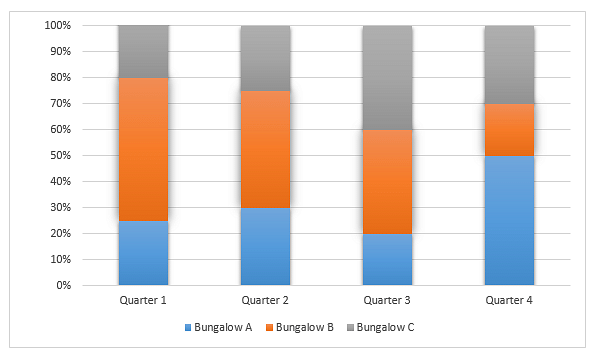
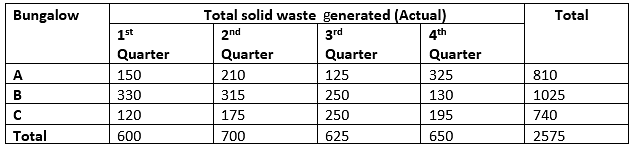
Directions: A housing society comprises 3 bungalows - A, B and C. The % solid waste generated by 3 bungalows over 4 quarters of 2018 is represented in the graph below. It is known that bungalow C generated 120 kg of waste in the 1st quarter, bungalow A generated 210 kg of waste in the 2nd quarter, bungalow B generated 250 kg of waste in the 3rd quarter, and bungalow A generated 325 kg of waste in the 4th quarter.

Q. Which of the following statements is/are true?
1. There is a gradual increase in the total solid waste generated by bungalow C in the 4 quarters.
2. There is a gradual decrease in the total solid waste generated by bungalow B in the 4 quarters.
3. Bungalow A generated the lowest quantity of waste in 2018.
4. Bungalow C generated the lowest quantity of waste in each quarter of 2018.
2. There is a gradual decrease in the total solid waste generated by bungalow B in the 4 quarters.
3. Bungalow A generated the lowest quantity of waste in 2018.
4. Bungalow C generated the lowest quantity of waste in each quarter of 2018.

Directions: A housing society comprises 3 bungalows - A, B and C. The % solid waste generated by 3 bungalows over 4 quarters of 2018 is represented in the graph below. It is known that bungalow C generated 120 kg of waste in the 1st quarter, bungalow A generated 210 kg of waste in the 2nd quarter, bungalow B generated 250 kg of waste in the 3rd quarter, and bungalow A generated 325 kg of waste in the 4th quarter.

Q. What is the average waste generated by bungalow A per month in 2018?
 kg = 67.5 kg
| 1 Crore+ students have signed up on EduRev. Have you? Download the App |
Directions: A housing society comprises 3 bungalows - A, B and C. The % solid waste generated by 3 bungalows over 4 quarters of 2018 is represented in the graph below. It is known that bungalow C generated 120 kg of waste in the 1st quarter, bungalow A generated 210 kg of waste in the 2nd quarter, bungalow B generated 250 kg of waste in the 3rd quarter, and bungalow A generated 325 kg of waste in the 4th quarter.
Q. In which quarter is the total solid waste generated by all the 3 bungalows the lowest?
Directions: A housing society comprises 3 bungalows - A, B and C. The % solid waste generated by 3 bungalows over 4 quarters of 2018 is represented in the graph below. It is known that bungalow C generated 120 kg of waste in the 1st quarter, bungalow A generated 210 kg of waste in the 2nd quarter, bungalow B generated 250 kg of waste in the 3rd quarter, and bungalow A generated 325 kg of waste in the 4th quarter.

Q. In which quarter is the highest quantity of solid waste generated?

Diections: The following bar chart shows the percentage distribution of total production of three different flavoured ice creams by five different companies (L, M, N, O and P) during the year 2015.

Q. If the total production of ice creams by company O is 150000 and that of company L is 120000, then the production of vanilla ice cream by company O is what percent of production of chocolate ice cream by company L?
 = 74.40%
Directions: The following bar chart shows the percentage distribution of total production of three different flavoured ice creams by five different companies (L, M, N, O and P) during the year 2015.

If the total production of chocolate flavoured ice cream by company N is 36000, then what is the difference between the total production of vanilla ice cream and mango ice cream by the same company?


Directions: The following bar chart shows the percentage distribution of total production of three different flavoured ice creams by five different companies (L, M, N, O and P) during the year 2015.

Q. If the total production of mango ice cream by company N is 58240 and the total production of vanilla ice cream by company L is 20% more than that of production of mango ice cream by company N, then what is the sum of the total production of ice cream by company N and L?


Directions: The following bar chart shows the percentage distribution of total production of three different flavoured ice creams by five different companies (L, M, N, O and P) during the year 2015.
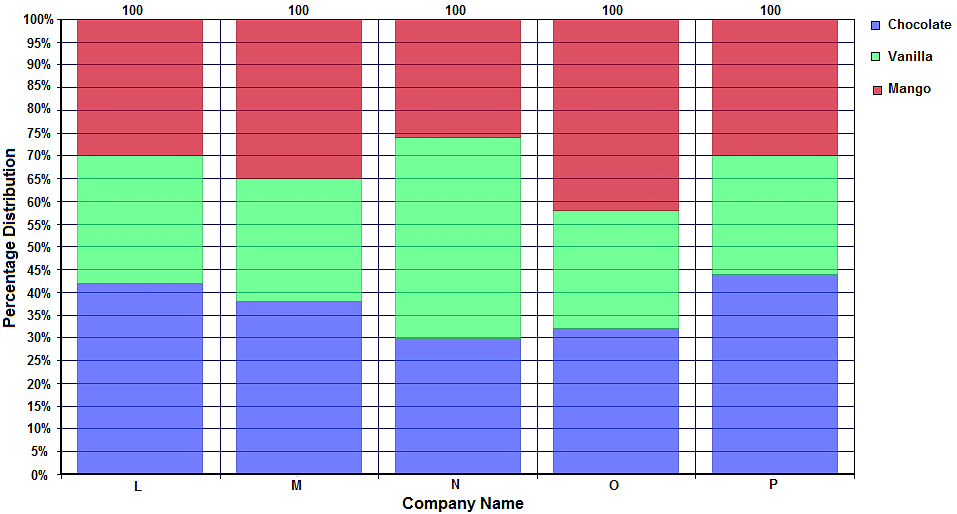
Q. If the production of chocolate ice cream by company P is 35200 and the total production of ice cream by company M isof the total production of ice cream by company P, then what is the total production of vanilla ice cream by company M?


 = 17280.
Directions: The bar chart shows the total manufacture of two different types of cars (Alpha and Beta) by five companies from the year 2011 - 2015.

Q. The average of total number of Beta cars manufactured by company A and Alpha cars by company D is what percentage of the total number of Alpha cars manufactured by company C and E?
Directions: The bar chart shows the total manufacture of two different types of cars (Alpha and Beta) by five companies from the year 2011 - 2015.

Q. What will be the ratio of the difference between number of Beta cars manufactured by company D and B to the total number of Alpha cars manufactured by company A and C?
Directions: The bar chart shows the total manufacture of two different types of cars (Alpha and Beta) by five companies from the year 2011 - 2015.
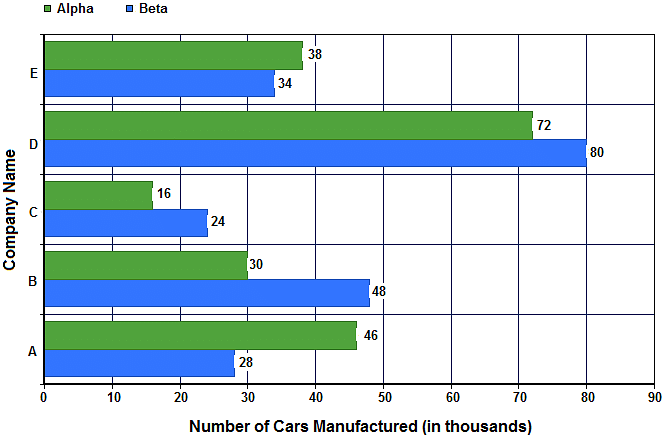
Q. If the total number of cars manufactured (both Alpha and Beta) by company A during 2011 and 2012 is 20,000 and the ratio of the number of Alpha cars manufactured to that of Beta cars is 13 : 7, then what is the percentage increase in the number of Alpha cars manufactured by company C during 2011 - 2015 to the numbers of Beta cars manufactured by company A during 2011 - 2012?


Directions: Study the following graph carefully and answer the question given below.

Q. If 40% of males and 30% of females in company D in the year 2012 were handicapped, then what was the total number of handicapped candidates in that company in that year?
Directions: Study the following graph carefully and answer the question given below.

Q. If there is a 20% increase in male employees in company B in 2016 as compared to 2015 and a 30% increase in female employees as well, then what will be the total number of employees in company B in 2016?
Directions: Study the following graph carefully and answer the question given below.

Q. What was the average number of female employees for company B from 2011 to 2015?

Directions: Study the following graph carefully and answer the question given below.
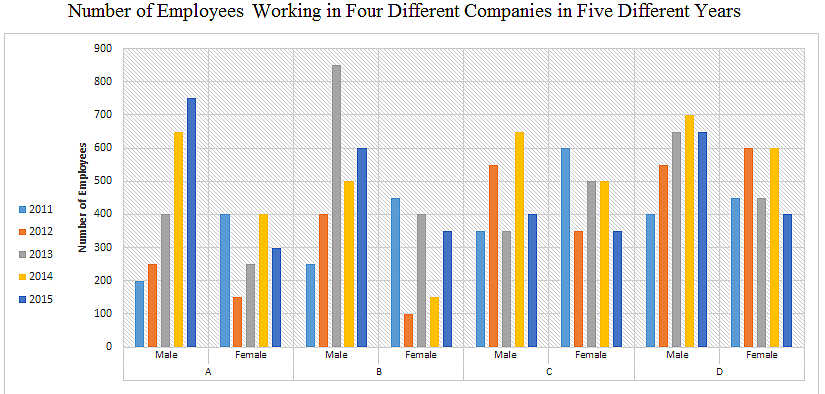
Q. What was the total number of males working in company A in 2014, males working in the company B in 2011, females working in company D in 2013 and females working in the company A in 2012?
Directions: Study the following chart carefully and answer the question given below.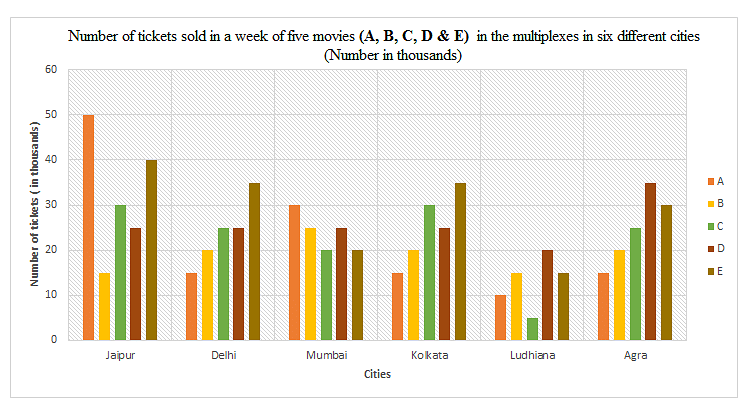
Q. What is the difference between the number of tickets of movie A sold in Jaipur and the number of tickets of movie C sold in Ludhiana?
Directions: Study the following chart carefully and answer the question given below:
Q. The number of tickets of movie B sold in Delhi is what percentage of the number of tickets of movie E sold in Jaipur?
Directions: Study the following bar graph carefully and answer the question that follows.

Q. If the total number of toys sold by company A in 5 months is 32.69% of the total number of toys sold by all three companies in 5 months, then find the percentage of total number of toys sold by company C in 5 months.
 = 33.17%
Directions: Study the following bar graph carefully and answer the question that follows.

Q. If the percentage increase in the sales of company C in April from March is 15.38%, then find the percentage decrease in the sales of the same company in May from April.
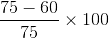 = 20%
= 20%Directions: Study the following bar graph carefully and answer the question that follows.
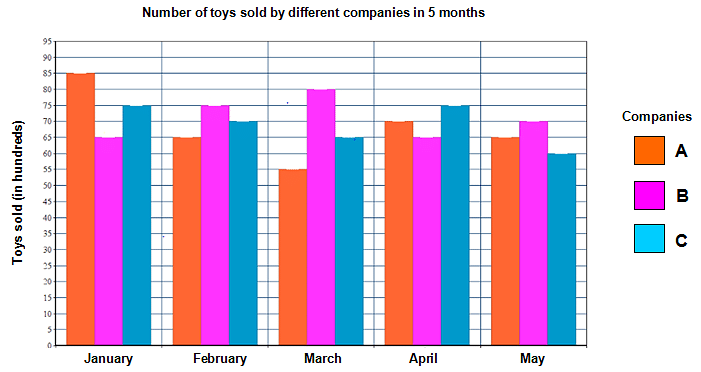
Q. If the average number of toys sold by company C was 69, then find the ratio of average number of toys sold by company A to average number of toys sold by company B.


Top Courses for CAT


Important Questions for Test Level 2: Bar Graph
Test Level 2: Bar Graph MCQs with Answers
Online Tests for Test Level 2: Bar Graph
|
© EduRev
|
Education Revolution
|


|


