Test Level 3: Bar Graph - CAT MCQ
20 Questions MCQ Test - Test Level 3: Bar Graph

Directions: Answers the question based on the given information.
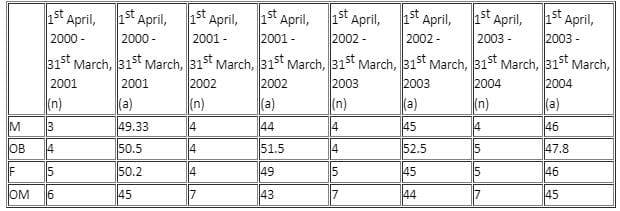
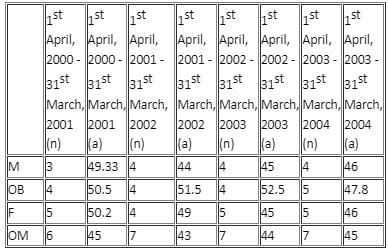
A management institute was established on 1st January, 2000, with 3, 4, 5 and 6 faculty members respectively in Marketing, Organisational Behaviour (OB), Finance, and Operations Management (OM) departments to start with. No faculty member retired or joined the institute in the first three months of the year 2000. In the next four years, the institute recruited one faculty member in each of the four departments. All these new faculty members, who joined the institute subsequently over the years, were 25 years old at the time of their joining the institute. All of them joined the institute on 1st April. During these four years, one of the faculty members retired at the age of 60. The following bar chart gives the department-wise average age (in terms of number of completed years) of faculty members as on April 1 of 2000, 2001, 2002 and 2003.
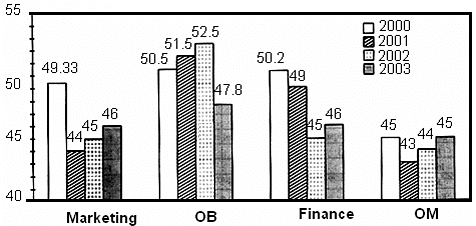
Q. What was the age of the new faculty member who joined the OM department on 1st April, 2003?
Directions: Answers the question based on the given information.
A management institute was established on 1st January, 2000, with 3, 4, 5 and 6 faculty members respectively in Marketing, Organisational Behaviour (OB), Finance, and Operations Management (OM) departments to start with. No faculty member retired or joined the institute in the first three months of the year 2000. In the next four years, the institute recruited one faculty member in each of the four departments. All these new faculty members, who joined the institute subsequently over the years, were 25 years old at the time of their joining the institute. All of them joined the institute on 1st April. During these four years, one of the faculty members retired at the age of 60. The following bar chart gives the department-wise average age (in terms of number of completed years) of faculty members as on April 1 of 2000, 2001, 2002 and 2003.

Q. Professors Naresh and Devesh, two faculty members of Marketing who have been with the institute since its inception, share their birthdays, which fall on 20th November. One was born in 1947 and the other in 1950. On 1st April, 2005, what was the approximate age of the third faculty member, who has been in the same area since inception?
| 1 Crore+ students have signed up on EduRev. Have you? Download the App |
Directions: Answers the question based on the given information.
A management institute was established on 1st January, 2000, with 3, 4, 5 and 6 faculty members respectively in Marketing, Organisational Behaviour (OB), Finance, and Operations Management (OM) departments to start with. No faculty member retired or joined the institute in the first three months of the year 2000. In the next four years, the institute recruited one faculty member in each of the four departments. All these new faculty members, who joined the institute subsequently over the years, were 25 years old at the time of their joining the institute. All of them joined the institute on 1st April. During these four years, one of the faculty members retired at the age of 60. The following bar chart gives the department-wise average age (in terms of number of completed years) of faculty members as on April 1 of 2000, 2001, 2002 and 2003.

Q. From which department did the faculty member retire?
Directions: Answers the question based on the given information.
A management institute was established on 1st January, 2000, with 3, 4, 5 and 6 faculty members respectively in Marketing, Organisational Behaviour (OB), Finance, and Operations Management (OM) departments to start with. No faculty member retired or joined the institute in the first three months of the year 2000. In the next four years, the institute recruited one faculty member in each of the four departments. All these new faculty members, who joined the institute subsequently over the years, were 25 years old at the time of their joining the institute. All of them joined the institute on 1st April. During these four years, one of the faculty members retired at the age of 60. The following bar chart gives the department-wise average age (in terms of number of completed years) of faculty members as on April 1 of 2000, 2001, 2002 and 2003.

Q. In which year did the new faculty member join the Finance department?
Directions: Answer the question on the basis of bar graphs given below.
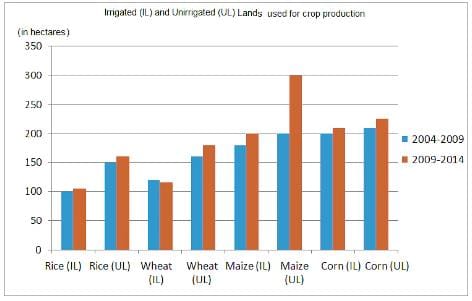
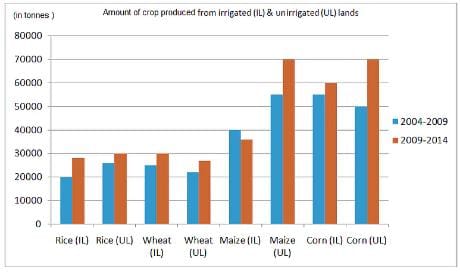
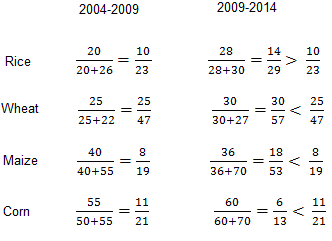
Q. Between the two given periods, the production in tonnes from irrigated land as a percentage of total production (irrigated land + unirrigated land for a particular crop) increased for

Directions: Answer the question on the basis of bar graphs given below.


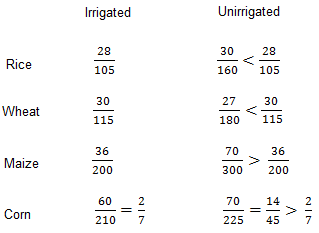
Q. During 2009-2014, for which of the following crops is the production in tonnes per hectare more for irrigated land than for unirrigated land?
Directions: Answer the question on the basis of bar graphs given below.
Q. During 2004 - 2009, the difference between rice and wheat production from irrigated land and rice and wheat production from unirrigated land is
Directions: Answer the question on the basis of bar graphs given below.
Q. During 2009 - 2014, maize production in tonnes per hectare of irrigated land as compared to that in 2004 - 2009 declined by


Directions: Read the following and answer the question.
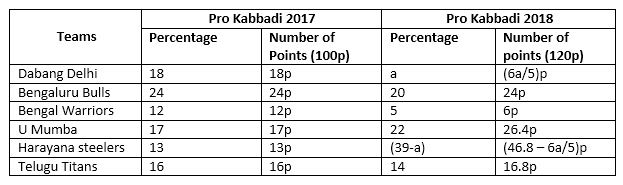
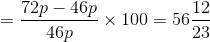
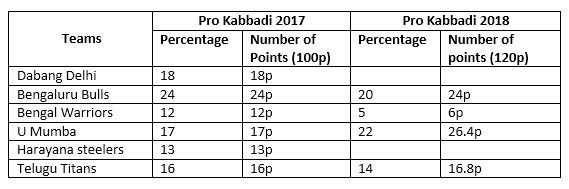
Indian Kabbadi team captain Ajay Thakur scored points against 6 different teams in Pro Kabbadi 2017 and Pro Kabbadi 2018. The bar charts given below depict the number of points scored by Ajay against the opponent as a percentage of total points scored in that Pro Kabbadi series. It is also given that the ratio of points scored by Ajay against Bengal Warriors in the Pro Kabbadi 2017 and Pro Kabbadi 2018 is 2 : 1, whereas the points scored against Bengaluru Bulls is the same in both Pro Kabbadi series.
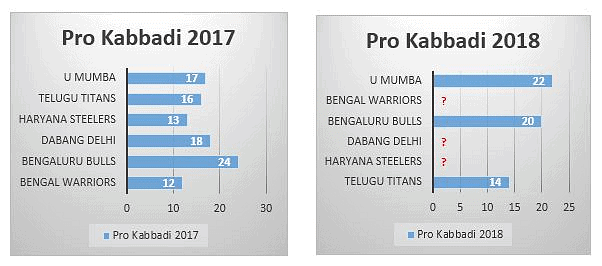
Q. If it is given that Ajay scored minimum possible points in Pro Kabbadi 2018, then what is the maximum difference in number of points scored by him against Haryana Steelers in both the Pro Kabbadi series?


Directions: Read the following and answer the question.
Indian Kabbadi team captain Ajay Thakur scored points against 6 different teams in Pro Kabbadi 2017 and Pro Kabbadi 2018. The bar charts given below depict the number of points scored by Ajay against the opponent as a percentage of total points scored in that Pro Kabbadi series. It is also given that the ratio of points scored by Ajay against Bengal Warriors in the Pro Kabbadi 2017 and Pro Kabbadi 2018 is 2 : 1, whereas the points scored against Bengaluru Bulls is the same in both Pro Kabbadi series.

Q. In Pro Kabbadi 2018, the sum of points scored against Dabang Delhi and Harayana Steelers as a percentage of total points is

Directions: Read the following and answer the question.
Indian Kabbadi team captain Ajay Thakur scored points against 6 different teams in Pro Kabbadi 2017 and Pro Kabbadi 2018. The bar charts given below depict the number of points scored by Ajay against the opponent as a percentage of total points scored in that Pro Kabbadi series. It is also given that the ratio of points scored by Ajay against Bengal Warriors in the Pro Kabbadi 2017 and Pro Kabbadi 2018 is 2 : 1, whereas the points scored against Bengaluru Bulls is the same in both Pro Kabbadi series.

Q. If the difference between points scored by Ajay against Dabang Delhi in both 2017 and 2018 is zero, then by what percentage is the number of points scored by Ajay against U Mumba, Haryana Steelers and Telugu Titans combined in Pro Kabbadi 2018 higher than in Pro Kabbadi 2017 against the same teams?


Directions: Read the following and answer the question.
Indian Kabbadi team captain Ajay Thakur scored points against 6 different teams in Pro Kabbadi 2017 and Pro Kabbadi 2018. The bar charts given below depict the number of points scored by Ajay against the opponent as a percentage of total points scored in that Pro Kabbadi series. It is also given that the ratio of points scored by Ajay against Bengal Warriors in the Pro Kabbadi 2017 and Pro Kabbadi 2018 is 2 : 1, whereas the points scored against Bengaluru Bulls is the same in both Pro Kabbadi series.

Q. In Pro Kabbadi 2018, the percentage of points scored against Dabang Delhi with respect to the total points scored is

Directions: The given questions are based on the following bar graphs giving the number of students in different branches in two engineering colleges for the years 1996 - 1997 and 1997 - 98:
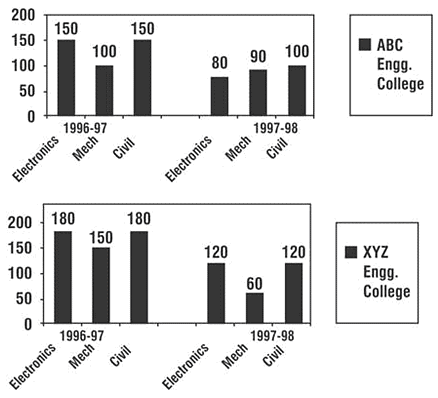
Q. If 60 students from electronics department and 60 students from mechanical department of XYZ Engineering College shift to ABC Engineering College in the year 1996 - 1997, then the percentage of electronics students in XYZ Engineering College to the total number of students in the college in 1996 - 1997 will be
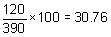 %, i.e. 31% (approx.)
Directions: The given questions are based on the following bar graphs giving the number of students in different branches in two engineering colleges for the years 1996 - 1997 and 1997 - 98:

Q. The number of students in XYZ engineering college for the years 1996 - 97 and 1997 - 98, put together, exceeds the number of students in ABC Engineering College, put together, for the same period by
Directions: The given questions are based on the following bar graphs giving the number of students in different branches in two engineering colleges for the years 1996 - 1997 and 1997 - 98:

Q. The percentage decrease in the number of students in the electronics faculty of ABC Engineering College for the period 1996 - 97 to 1997 - 98 exceeds the percentage decrease in the number of students in electronics faculty of XYZ Engineering College for the same period by around

 100 for electronics
 for electronics
 100
100Directions: Answer the question based on the information given below.
The following chart shows the runs scored by Dravid in the year 2006-07.

Best = Highest score in any match
Average = Total runs scored/Number of outs
Q. If Dravid was out in all the innings he played, what is the maximum possible average can he have? (If his best is 120)
 , it will become maximum if total runs scored is maximum.
 19 + 12
  39 + 18
  59 + 20
  79 + 8
  99 + 5
  120 = 4635 (Since best is 120).
Directions: Answer the question based on the information given below.
The following chart shows the runs scored by Dravid in the year 2006-07.
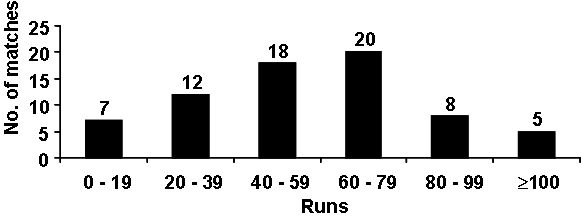
Q. Dravid scored 4000 runs in total during 2006-07. If his score was different in each match, what could be his best score?
 +
+ 
 (20 + 31) +
  (40 + 57) +
  (60 + 79) +
  (80 + 87) + 100 + 101 + 102 + 103 = 3664
Directions: Study the following bar graph carefully and answer the question that follows.
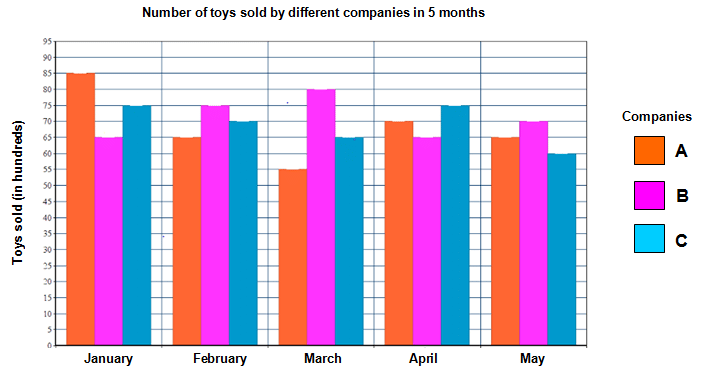
Q. If the average cost of toys of company A in January was Rs. 112 and the average cost of toys of company B in the same month was Rs. 106, then find the difference between the total costs of toys of companies A and B sold in January.
Directions: Study the following bar graph carefully and answer the question that follows.

Q. In February, the total sales by company A, B and C was 210 (in hundreds). In which month were the sales of all the companies in total minimum?
Directions: Study the following chart carefully and answer the question given below: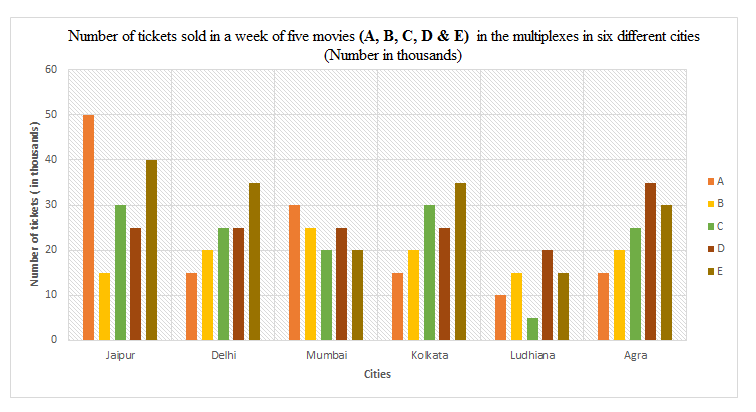
Q. In which city was the total number of tickets of all the five movies together sold the minimum?
Top Courses for CAT


Important Questions for Test Level 3: Bar Graph
Test Level 3: Bar Graph MCQs with Answers
Online Tests for Test Level 3: Bar Graph
|
© EduRev
|
Education Revolution
|


Follow Us
|


