SAT Exam  >  SAT Tests  >  Test (With calculator) - 1 - SAT MCQ

Test (With calculator) - 1 - SAT MCQ


Test Description

10 Questions MCQ Test - Test (With calculator) - 1

Test (With calculator) - 1 for SAT 2024 is part of SAT preparation. The Test (With calculator) - 1 questions and answers have been prepared according to the SAT exam syllabus.The Test (With calculator) - 1 MCQs are made for SAT 2024 Exam. Find important definitions, questions, notes, meanings, examples, exercises, MCQs and online tests for Test (With calculator) - 1 below.
Solutions of Test (With calculator) - 1 questions in English are available as part of our course for SAT & Test (With calculator) - 1 solutions in Hindi for SAT course. Download more important topics, notes, lectures and mock test series for SAT Exam by signing up for free. Attempt Test (With calculator) - 1 | 10 questions in 15 minutes | Mock test for SAT preparation | Free important questions MCQ to study for SAT Exam | Download free PDF with solutions
Test (With calculator) - 1 - Question 1

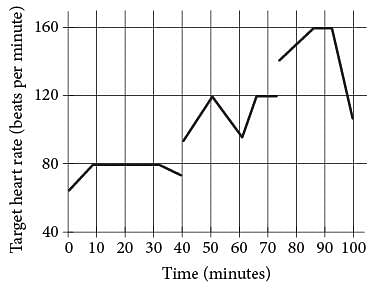
John runs at different speeds as part of his training program. The graph shows his target heart rate at different times during his workout. On which interval is the target heart rate strictly increasing then strictly decreasing?
Detailed Solution for Test (With calculator) - 1 - Question 1

On the graph, a line segment with a positive slope represents an interval over which the target heart rate is strictly increasing as time passes. A horizontal line segment represents an interval over which there is no change in the target heart rate as time passes, and a line segment with a negative slope represents an interval over which the target heart rate is strictly decreasing as time passes. Over the interval between 40 and 60 minutes, the graph consists of a line segment with a positive slope followed by a line segment with a negative slope, with no horizontal line segment in between, indicating that the target heart rate is strictly increasing then strictly decreasing.
Choice A is incorrect because the graph over the interval between 0 and 30 minutes contains a horizontal line segment, indicating a period in which there was no change in the target heart rate. Choice C is incorrect because the graph over the interval between 50 and 65 minutes consists of a line segment with a negative slope followed by a line segment with a positive slope, indicating that the target heart rate is strictly decreasing then strictly increasing. Choice D is incorrect because the graph over the interval between 70 and 90 minutes contains horizontal line segments and no segment with a negative slope.

Test (With calculator) - 1 - Question 2

If y = kx, where k is a constant, and y = 24 when x = 6, what is the value of y when x = 5?

Detailed Solution for Test (With calculator) - 1 - Question 2

Substituting 6 for x and 24 for y in y = kx gives 24 = (k)(6), which gives k = 4. Hence, y = 4x. Therefore, when x = 5, the value of y is (4)(5) = 20. None of the other choices for y is correct because y is a function of x, and so there is only one y-value for a given x-value.
Choices A, B, and D are incorrect. Choice A is the result of substituting 6 for y and substituting 5 for x in the equation y = kx, when solving for k. Choice B results from substituting 3 for k and 5 for x in the equation y = kx, when solving for y. Choice D results from using y = k + x instead of y = kx.

1 Crore+ students have signed up on EduRev. Have you? Download the App
Test (With calculator) - 1 - Question 3


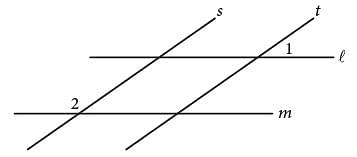
In the figure above, lines l and m are parallel and lines s and t are parallel. If the measure of ∠1 is 35°, what is the measure of ∠2?
Detailed Solution for Test (With calculator) - 1 - Question 3

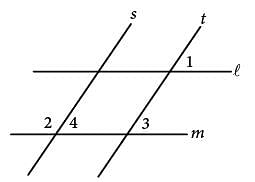
Consider the measures of ∠3 and ∠4 in the figure below.

The measure of ∠3 is equal to the measure of ∠1 because they are corresponding angles for the parallel lines 2 and m intersected by the transversal line t. Similarly, the measure of ∠3 is equal to the measure of ∠4 because they are corresponding angles for the parallel lines s and t intersected by the transversal line m. Since the measure of ∠1 is 35°, the measures of ∠3 and ∠4 are also 35°. Since ∠4 and ∠2 are supplementary angles, the sum of the measures of these two angles is 180°. Therefore, the measure of ∠2 is 180° - 35° = 145°.
Choice A is incorrect because 35° is the measure of ∠1, and ∠1 is not congruent to ∠2. Choice B is incorrect because it is the measure of the complementary angle of ∠1, and ∠1 and ∠2 are not complementary angles. Choice C is incorrect because it is double the measure of ∠1, which cannot be inferred from the information given.

Test (With calculator) - 1 - Question 4

If 16 + 4x is 10 more than 14, what is the value of 8x?

Detailed Solution for Test (With calculator) - 1 - Question 4

The description “16 + 4x is 10 more than 14” can be written as the equation 16 + 4x =10 + 14, which is equivalent to 16 + 4x = 24. Subtracting 16 from each side of 16 + 4x = 24 gives 4x = 8. Since 8x is 2 times 4x, multiplying both sides of 4x = 8 by 2 gives 8x = 16. Therefore, the value of 8x is 16.
Choice A is incorrect because it is the value of x, not 8x. Choices B and D are incorrect and may be the result of errors made when solving the equation 16 + 4x = 10 + 14 for x. For example, choice D could be the result of subtracting 16 from the left side of the equation and adding 16 to the right side of the equation 16 + 4x = 10 + 14, giving 4x = 40 and 8x =80.

Test (With calculator) - 1 - Question 5

Which of the following graphs best shows a strong negative association between d and t?

Detailed Solution for Test (With calculator) - 1 - Question 5

A graph with a strong negative association between d and t would have the points on the graph closely aligned with a line that has a negative slope. The more closely the points on a graph are aligned with a line, the stronger the association between d and t, and a negative slope indicates a negative association. Of the four graphs, the points on graph D are most closely aligned with a line with a negative slope. Therefore, the graph in choice D has the strongest negative association between d and t.
Choice A is incorrect because the points are more scattered than the points in choice D, indicating a weaker negative association between d and t. Choice B is incorrect because the points are aligned to either a curve or possibly a line with a small positive slope. Choice C is incorrect because the points are aligned to a line with a positive slope, indicating a positive association between d and t.

Test (With calculator) - 1 - Question 6


A hospital stores one type of medicine in 2-decagram containers. Based on the information given in the box above, how many 1-milligram doses are there in one 2-decagram container?
Detailed Solution for Test (With calculator) - 1 - Question 6

Since there are 10 grams in 1 decagram, there are 2 * 10 = 20 grams in 2 decagrams. Since there are 1,000 milligrams in 1 gram, there are 20 * 1,000 = 20,000 milligrams in 20 grams. Therefore, 20,000 1-milligram doses of the medicine can be stored in a 2-decagram container.
Choice A is incorrect; 0.002 is the number of grams in 2 milligrams. Choice B is incorrect; it could result from multiplying by 1,000 and dividing by 10 instead of multiplying by both 1,000 and 10 when converting from decagrams to milligrams. Choice C is incorrect; 2,000 is the number of milligrams in 2 grams, not the number of milligrams in 2 decagrams.

Test (With calculator) - 1 - Question 7


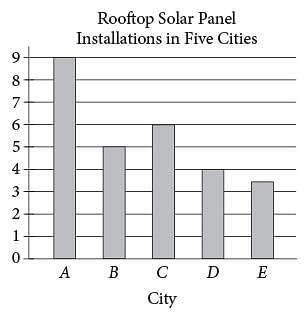
The number of rooftops with solar panel installations in 5 cities is shown in the graph above. If the total number of installations is 27,500, what is an appropriate label for the vertical axis of the graph?

Detailed Solution for Test (With calculator) - 1 - Question 7

Let x represent the number of installations that each unit on the y-axis represents. Then 9x, 5x, 6x, 4x, and 3.5x are the number of rooftops with solar panel installations in cities A, B, C, D, and E, respectively. Since the total number of rooftops is 27,500, it follows that 9x + 5x + 6x + 4x+ 3.5x = 27,500, which simplifies to 27.5x = 27,500. Thus, x= 1,000. Therefore, an appropriate label for the y-axis is “Number of installations (in thousands).”
Choices A, B, and D are incorrect and may result from errors when setting up and calculating the units for the y-axis.

Test (With calculator) - 1 - Question 8

For what value of n is |n − 1| + 1 equal to 0?

Detailed Solution for Test (With calculator) - 1 - Question 8

If the value of |n − 1| + 1 is equal to 0, then in |n − 1| + 1 = 0. Subtracting 1 from both sides of this equation gives in |n − 1|  = -1. The expression |n − 1| lion the left side of the equation is the absolute value of n - 1, and the absolute value of a quantity can never be negative. Thus |n − 1| = -1 has no solution. Therefore, there are no values for n for which the value of |n − 1| + 1 is equal to 0.
Choice A is incorrect because |0 − 1|  + 1 = 1 + 1 = 2, not 0. Choice B is incorrect because |1 − 1| + 1 = 0 + 1 = 1, not 0. Choice C is incorrect because |2 − 1| + 1 = 1 + 1 = 2, not 0.

Test (With calculator) - 1 - Question 9

Question refer to the following information.
a = 1,052 + 1.08t
The speed of a sound wave in air depends on the air temperature. The formula above shows the relationship between a, the speed of a sound wave, in feet per second, and t, the air temperature, in degrees Fahrenheit (°F).

Which of the following expresses the air temperature in terms of the speed of a sound wave?

Detailed Solution for Test (With calculator) - 1 - Question 9

Subtracting 1,052 from both sides of the equation a = 1,052 + 1.08t gives a - 1,052 = 1.08t. Then dividing both sides of a - 1,052 = 1.08f by 1.08 gives 
Choices B, C, and D are incorrect and could arise from errors in rewriting a = 1,052 + 1.08f. For example, choice B could result if 1,052 is added to the left side of a = 1,052 + 1.08f and subtracted from the right side, and then both sides are divided by 1.08.

Test (With calculator) - 1 - Question 10

Question refer to the following information.
a = 1,052 + 1.08t
The speed of a sound wave in air depends on the air temperature. The formula above shows the relationship between a, the speed of a sound wave, in feet per second, and t, the air temperature, in degrees Fahrenheit (°F).

At which of the following air temperatures will the speed of a sound wave be closest to 1,000 feet per second?

Detailed Solution for Test (With calculator) - 1 - Question 10

The air temperature at which the speed of a sound wave is closest to 1,000 feet per second can be found by substituting 1,000 for a and then solving for t in the given formula. Substituting 1,000 for a in the equation a = 1,052 + 1.08t gives 1,000 = 1,052 + 1.08t. Subtracting 1,052 from both sides of the equation 1,000 = 1,052 + 1.08t and then dividing both sides of the equation byl.08 yields
 Of the choices given, -48°F is closest to -48.15°F.
Choices A, C, and D are incorrect and might arise from errors made when substituting 1,000 for a or solving for t in the equation a = 1,052 + 1.08t or in rounding the result to the nearest integer. For example, choice C could be the result of rounding -48.15 to -49 instead of -48.

Information about Test (With calculator) - 1 Page
In this test you can find the Exam questions for Test (With calculator) - 1 solved & explained in the simplest way possible. Besides giving Questions and answers for Test (With calculator) - 1, EduRev gives you an ample number of Online tests for practice

Top Courses for SAT

Download as PDF

Top Courses for SAT