SSC CGL Exam  >  SSC CGL Tests  >  SSC CGL Previous Year Questions: Data Interpretation - 1 - SSC CGL MCQ

SSC CGL Previous Year Questions: Data Interpretation - 1 - SSC CGL MCQ


Test Description

20 Questions MCQ Test - SSC CGL Previous Year Questions: Data Interpretation - 1

SSC CGL Previous Year Questions: Data Interpretation - 1 for SSC CGL 2024 is part of SSC CGL preparation. The SSC CGL Previous Year Questions: Data Interpretation - 1 questions and answers have been prepared according to the SSC CGL exam syllabus.The SSC CGL Previous Year Questions: Data Interpretation - 1 MCQs are made for SSC CGL 2024 Exam. Find important definitions, questions, notes, meanings, examples, exercises, MCQs and online tests for SSC CGL Previous Year Questions: Data Interpretation - 1 below.
Solutions of SSC CGL Previous Year Questions: Data Interpretation - 1 questions in English are available as part of our course for SSC CGL & SSC CGL Previous Year Questions: Data Interpretation - 1 solutions in Hindi for SSC CGL course. Download more important topics, notes, lectures and mock test series for SSC CGL Exam by signing up for free. Attempt SSC CGL Previous Year Questions: Data Interpretation - 1 | 20 questions in 20 minutes | Mock test for SSC CGL preparation | Free important questions MCQ to study for SSC CGL Exam | Download free PDF with solutions
SSC CGL Previous Year Questions: Data Interpretation - 1 - Question 1

DIRECTIONS: In the following questions, select the related word pair from the given alternatives.
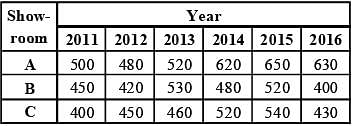
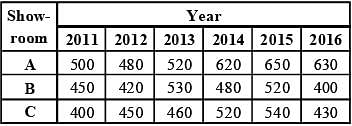
The Table shows the number of cars sold by three showrooms over a period of six years.
       (SSC CGL-2018)

Q. If the total number of cars sold by all three showrooms over the years is represented as a pie-chart, what is the central angle of the sector representing the total number of cars sold in the year 2013 (to the nearest whole number)?

Detailed Solution for SSC CGL Previous Year Questions: Data Interpretation - 1 - Question 1

Central angle made by total number of cars sold in year 2013

SSC CGL Previous Year Questions: Data Interpretation - 1 - Question 2

DIRECTIONS: In the following questions, select the related word pair from the given alternatives.
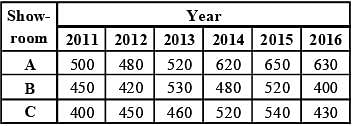
The Table shows the number of cars sold by three showrooms over a period of six years.
       (SSC CGL-2018)

Q. What is the ratio of the total cars sold by showroom B during the years 2014 and 2016 and the total cars sold by showroom C during 2015 and 2016?

Detailed Solution for SSC CGL Previous Year Questions: Data Interpretation - 1 - Question 2

Required ratio = 

1 Crore+ students have signed up on EduRev. Have you? Download the App
SSC CGL Previous Year Questions: Data Interpretation - 1 - Question 3

DIRECTIONS: In the following questions, select the related word pair from the given alternatives.
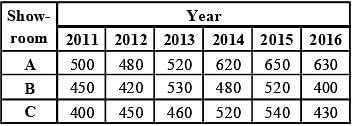
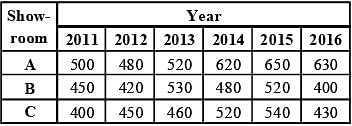
The Table shows the number of cars sold by three showrooms over a period of six years.
       (SSC CGL-2018)

Q. By what percent did the total number of cars sold by all three showrooms decrease during the year 2016, as compared to that in the year 2015 (nearest to one decimal place)?

Detailed Solution for SSC CGL Previous Year Questions: Data Interpretation - 1 - Question 3

Required percent decrease

SSC CGL Previous Year Questions: Data Interpretation - 1 - Question 4

DIRECTIONS: In the following questions, select the related word pair from the given alternatives.
The Table shows the number of cars sold by three showrooms over a period of six years.
       (SSC CGL-2018)

Q. What is the average number of cars sold by showroom A over the given six years (nearest to one decimal place)?

Detailed Solution for SSC CGL Previous Year Questions: Data Interpretation - 1 - Question 4

Average number of cars sold by A

= 3400/6 = 566.7

SSC CGL Previous Year Questions: Data Interpretation - 1 - Question 5

DIRECTIONS: In the following questions, select the related word pair from the given alternatives.
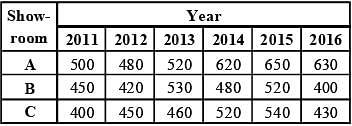
The Table shows the number of cars sold by three showrooms over a period of six years.
       (SSC CGL-2018)

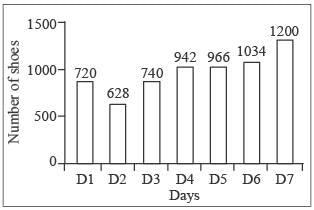
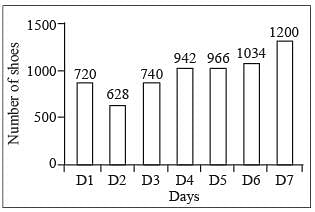
Q. The Bar graph given below presents the number of shoes manufactured by a company on the different days of a week.

What is the total number of shoes manufactured by the company on all seven days together?

Detailed Solution for SSC CGL Previous Year Questions: Data Interpretation - 1 - Question 5

The total number of shoes nanufactured by the company on all seven days together is Days = D1 + D2 + D3 + D4 + D5 + D6 + D7
= 720 + 628 + 740 + 942 + 966 + 1034 + 1200 = 6230

SSC CGL Previous Year Questions: Data Interpretation - 1 - Question 6

DIRECTIONS: In the following questions, select the related word pair from the given alternatives.
The Table shows the number of cars sold by three showrooms over a period of six years.
       (SSC CGL-2018)

Q. The Bar graph given below presents the number of shoes manufactured by a company on the different days of a week.

The number of shoes manufactured on D5 is how much more than the average number of shoes manufactured per day?

Detailed Solution for SSC CGL Previous Year Questions: Data Interpretation - 1 - Question 6

The number of shoes manufactured on D5 = 966
Average of shoes manufactured per day = 6230/7 = 890
966 – 890 = 76

SSC CGL Previous Year Questions: Data Interpretation - 1 - Question 7

DIRECTIONS: In the following questions, select the related word pair from the given alternatives.
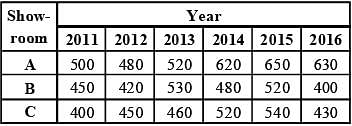
The Table shows the number of cars sold by three showrooms over a period of six years.
       (SSC CGL-2018)

Q. The Bar graph given below presents the number of shoes manufactured by a company on the different days of a week.
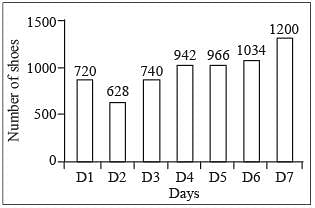
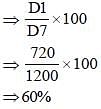
The number of shoes manufactured on D1 is what percentage of shoes manufactured on D7?

Detailed Solution for SSC CGL Previous Year Questions: Data Interpretation - 1 - Question 7

The number of shoes manufactured on D1 is = 720
Hence number of shoes manufactured on D7 is = 1200
The number of shoes manufactured on D1 is what percentage of shoes manufactured on D7 the percentage is

SSC CGL Previous Year Questions: Data Interpretation - 1 - Question 8

DIRECTIONS: The table below shows the number of students enrolled in five colleges over the five years (2010 to 2014).
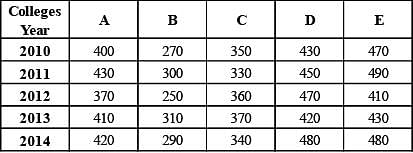
      (SSC CGL-2018)

Q. In the year 2014, what percent of students were enrolled in college C (correct to one decimal place)?

Detailed Solution for SSC CGL Previous Year Questions: Data Interpretation - 1 - Question 8

Required percent 

SSC CGL Previous Year Questions: Data Interpretation - 1 - Question 9

DIRECTIONS: The table below shows the number of students enrolled in five colleges over the five years (2010 to 2014).
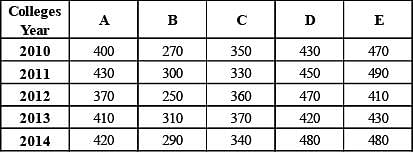
      (SSC CGL-2018)

Q. What is the ratio of the total students enrolled in colleges A and B in the year 2012 to the total students enrolled in colleges D and E in the year 2013?

Detailed Solution for SSC CGL Previous Year Questions: Data Interpretation - 1 - Question 9

Required ratio = 

SSC CGL Previous Year Questions: Data Interpretation - 1 - Question 10

DIRECTIONS: The table below shows the number of students enrolled in five colleges over the five years (2010 to 2014).
      (SSC CGL-2018)

Q. The number of students studyin g in college E in the year 2013 is approximately what percent of the number of students studying in colleges B, C and D taken together in the year 2013 (nearest to one decimal place)?

Detailed Solution for SSC CGL Previous Year Questions: Data Interpretation - 1 - Question 10

Required percent 

SSC CGL Previous Year Questions: Data Interpretation - 1 - Question 11

DIRECTIONS: The table below shows the number of students enrolled in five colleges over the five years (2010 to 2014).
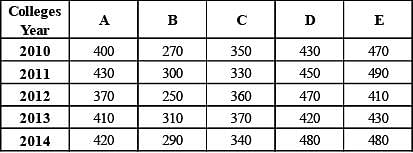
      (SSC CGL-2018)

Q. What is the average number of students studying in college D over the given years?

Detailed Solution for SSC CGL Previous Year Questions: Data Interpretation - 1 - Question 11

Average number of students 

SSC CGL Previous Year Questions: Data Interpretation - 1 - Question 12

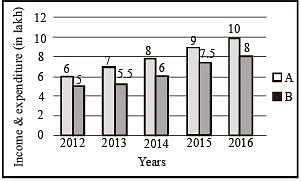
The given Bar Graph presents the data of annual income (A) and annual expenditure (B) of an IT officer in a multinational  company during the years 2012 to 2016.

What is the ratio between the ratios of Savings to Expenditure, respectively for the periods 2012-13 and 2015-16?       (SSC CHSL-2018)

Detailed Solution for SSC CGL Previous Year Questions: Data Interpretation - 1 - Question 12

Saving in 2012 – 13 = (6 – 5) + (7 – 5.5) = 1 + 1.5 = 2.5.
Saving in 2015 – 16 = (9 – 7.5) + (10 – 8) = 1.5 + 2 = 3.5
Ratio in 2012 – 13 = 
Ratio in 2015 – 16 = 
Required ratio = 

SSC CGL Previous Year Questions: Data Interpretation - 1 - Question 13

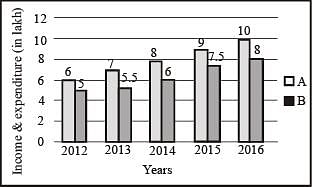
The given Bar Graph presents the data of annual income (A) and annual expenditure (B) of an IT officer in a multinational company during the years 2012 to 2016.
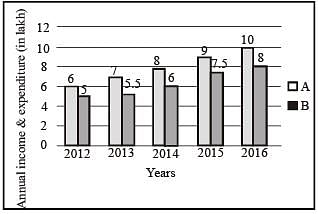
What is the percentage of his total savings with reference to his total income for the period 2012-15?     (SSC CHSL-2018)

Detailed Solution for SSC CGL Previous Year Questions: Data Interpretation - 1 - Question 13

Total saving from 2012 to 2015
= (6 – 5) + (7 – 5.5) + (8 – 6) + (9 – 7.5) + (10 – 8)
= 1 + 1.5 + 2 + 1.5 + 2 = 8
Total income from 2012 to 2015
= 6 + 7 + 8 + 9 + 10 = 40
Required percent = (8/40) x 100 = 20%.

SSC CGL Previous Year Questions: Data Interpretation - 1 - Question 14

The given Bar Graph presents the data of annual income (A) and annual expenditure (B) of an IT officer in a multi-national company during the years 2012 to 2016.

What was his average monthly savings (in ₹) in 2015 and 2016, taken together (correct to two decimal places)?       (SSC CHSL-2018)

Detailed Solution for SSC CGL Previous Year Questions: Data Interpretation - 1 - Question 14

Saving in 2015 = 9 – 7.5 = 1.5
Saving in 2016 = 10 – 8 = 2
Monthly average saving in 2015 and 2016

= ₹14583.33

SSC CGL Previous Year Questions: Data Interpretation - 1 - Question 15

The given Bar Graph presents the data of annual income (A)  and annual expenditure (B) of an IT officer in a multinational company during the years 2012 to 2016.
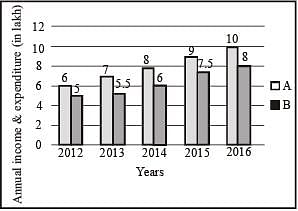
For which pair of years, the ratio of savings to expenditure is equal?       (SSC CHSL-2018)
Detailed Solution for SSC CGL Previous Year Questions: Data Interpretation - 1 - Question 15

Saving in 2012 = 6 – 5 = 1.
Ratio of saving to expenditure = 1/5 = 0.2 saving in 2015 = 9 – 7.5 = 1.5
Ratio of saving to expenditure = 
Hence, Ratio are equal in 2012 and 2015.

SSC CGL Previous Year Questions: Data Interpretation - 1 - Question 16


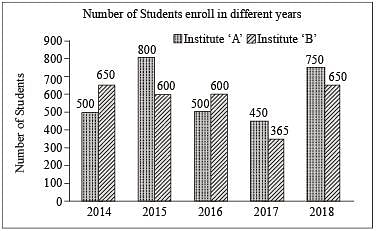
In the given bar graph, the number of students enrolled in institute B in the year 2016 is what percentage of students enrolled in institute A in 2016?        (SSC Sub. Ins. 2018)
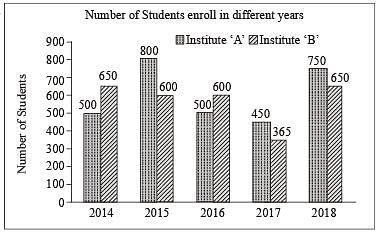
Detailed Solution for SSC CGL Previous Year Questions: Data Interpretation - 1 - Question 16

Number of students enrolled in B in 2016 = 600.
Number of students enrolled in A in 2016 = 500.
Required percent = (600/500)x100 = 120%.

SSC CGL Previous Year Questions: Data Interpretation - 1 - Question 17


In the given bar graph, the percentage decrease in the number of students in Institute A in 2016 is what percent of students in 2015.      (SSC Sub. Ins. 2018) 
Detailed Solution for SSC CGL Previous Year Questions: Data Interpretation - 1 - Question 17

Number of student in institute A in 2015 = 800
Number of student in institute A in 2016 = 500
Percentage decrease in number 

SSC CGL Previous Year Questions: Data Interpretation - 1 - Question 18


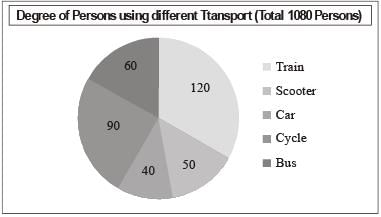
In the given pie-chart, what is the ratio of the total number of persons using train and car together to the total number of persons using other modes of transport to reach their workplace?       (SSC Sub. Ins. 2018)
Detailed Solution for SSC CGL Previous Year Questions: Data Interpretation - 1 - Question 18

Total number of persons using train and car together

Total number of person using other mode of transport = 1080 – 480 = 600
Required ratio = 480/600 = 4/5.

SSC CGL Previous Year Questions: Data Interpretation - 1 - Question 19


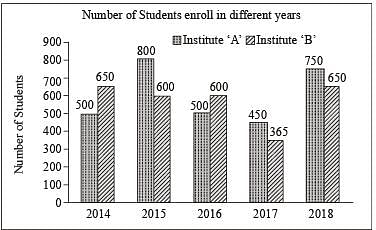
In the given bar graph, what is the ratio of students of A and B in the combine strength from 2016 to 2018?      (SSC Sub. Ins. 2018)
Detailed Solution for SSC CGL Previous Year Questions: Data Interpretation - 1 - Question 19

Total number of students of A in 2016 to 2018 = 500 + 450 + 750 = 1700
Total number of students of B in 2016 to 2018 = 600 + 365 + 650 = 1615
Required ratio = 1700/1615 = 20/19

SSC CGL Previous Year Questions: Data Interpretation - 1 - Question 20


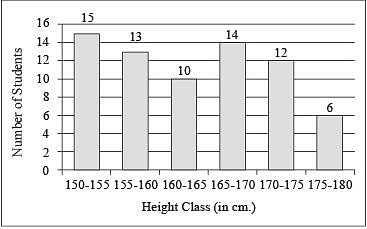
In the given histogram, what is the percentage of students whose height is in the class interval 165-170?      (SSC Sub. Ins. 2018)

Detailed Solution for SSC CGL Previous Year Questions: Data Interpretation - 1 - Question 20

Total number of students = 15 + 13 + 10 + 14 + 12 + 6 = 70
Number of students in class interval 165 – 170 = 14
Required percent = (14/70)x100 = 20%.

Information about SSC CGL Previous Year Questions: Data Interpretation - 1 Page
In this test you can find the Exam questions for SSC CGL Previous Year Questions: Data Interpretation - 1 solved & explained in the simplest way possible. Besides giving Questions and answers for SSC CGL Previous Year Questions: Data Interpretation - 1, EduRev gives you an ample number of Online tests for practice

Top Courses for SSC CGL

Download as PDF

Top Courses for SSC CGL