SSC CGL Exam  >  SSC CGL Tests  >  SSC CGL Previous Year Questions: Data Interpretation - 2 - SSC CGL MCQ
SSC CGL Previous Year Questions: Data Interpretation - 2 - SSC CGL MCQ


Test Description

30 Questions MCQ Test - SSC CGL Previous Year Questions: Data Interpretation - 2

SSC CGL Previous Year Questions: Data Interpretation - 2 for SSC CGL 2024 is part of SSC CGL preparation. The SSC CGL Previous Year Questions: Data Interpretation - 2 questions and answers have been prepared according to the SSC CGL exam syllabus.The SSC CGL Previous Year Questions: Data Interpretation - 2 MCQs are made for SSC CGL 2024 Exam. Find important definitions, questions, notes, meanings, examples, exercises, MCQs and online tests for SSC CGL Previous Year Questions: Data Interpretation - 2 below.
Solutions of SSC CGL Previous Year Questions: Data Interpretation - 2 questions in English are available as part of our course for SSC CGL & SSC CGL Previous Year Questions: Data Interpretation - 2 solutions in Hindi for SSC CGL course. Download more important topics, notes, lectures and mock test series for SSC CGL Exam by signing up for free. Attempt SSC CGL Previous Year Questions: Data Interpretation - 2 | 30 questions in 30 minutes | Mock test for SSC CGL preparation | Free important questions MCQ to study for SSC CGL Exam | Download free PDF with solutions
SSC CGL Previous Year Questions: Data Interpretation - 2 - Question 1


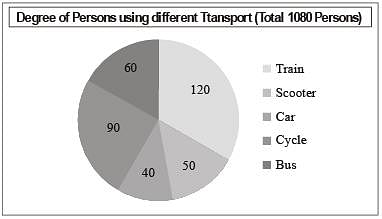
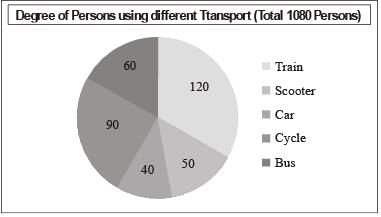
In the given pie-chart, the number of persons using a car is what percentage of persons using a scooter?        (SSC Sub. Ins. 2018)

Detailed Solution for SSC CGL Previous Year Questions: Data Interpretation - 2 - Question 1

Number of persons using scooter 
Number of persons using car 
Required percent = (120/150)x100 = 80%

SSC CGL Previous Year Questions: Data Interpretation - 2 - Question 2


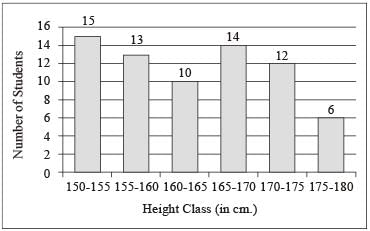
In the given histogram, the number of students whose height is in the class interval 175 - 180 is, what percent less than the number of students whose height is in the class interval 160 - 165?       (SSC Sub. Ins. 2018)
Detailed Solution for SSC CGL Previous Year Questions: Data Interpretation - 2 - Question 2

Number of students whose height is in the class interval= 175 – 180 = 6
Number of students whose height is in the class interval= 160 – 165 = 10
% Difference 

1 Crore+ students have signed up on EduRev. Have you? Download the App
SSC CGL Previous Year Questions: Data Interpretation - 2 - Question 3


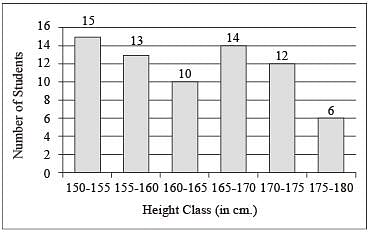
In the given histogram, which class is the median class?        (SSC Sub. Ins. 2018)
Detailed Solution for SSC CGL Previous Year Questions: Data Interpretation - 2 - Question 3

Here from the given histogram, we see the median class is 160 – 165.

SSC CGL Previous Year Questions: Data Interpretation - 2 - Question 4


In the given pie-chart, how many persons are using train to reach their workplace?      (SSC Sub. Ins. 2018)

Detailed Solution for SSC CGL Previous Year Questions: Data Interpretation - 2 - Question 4

Total number of persons = 1080.
Degree of persons using train = 120°.
∴ Number of persons using train = (120/360) x 1080 = 360

SSC CGL Previous Year Questions: Data Interpretation - 2 - Question 5

DIRECTIONS: The pie chart given below shows the expenditure (in percentage) of Mahesh. The monthly income of Mahesh is ₹ 26000.       (SSC Sub. Ins. 2017)
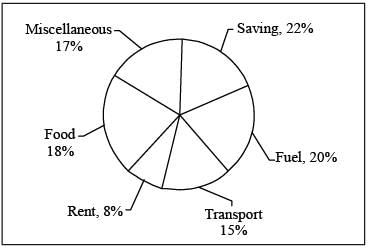
Q. How much does he spend (in ₹) on Rent? 

Detailed Solution for SSC CGL Previous Year Questions: Data Interpretation - 2 - Question 5

Total money spend on rent
= 26000 x (8/100) = 2080

SSC CGL Previous Year Questions: Data Interpretation - 2 - Question 6

DIRECTIONS: The pie chart given below shows the expenditure (in percentage) of Mahesh. The monthly income of Mahesh is ₹ 26000.       (SSC Sub. Ins. 2017)
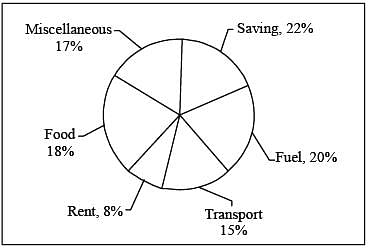
Q. How much more does he spend (in ₹) on the saving and fuel taken together than transport?

Detailed Solution for SSC CGL Previous Year Questions: Data Interpretation - 2 - Question 6

Total spend on transport 
Total spend on saving and fuel

Required difference = (10920 – 3900) = 7020.

SSC CGL Previous Year Questions: Data Interpretation - 2 - Question 7

DIRECTIONS: The pie chart given below shows the expenditure (in percentage) of Mahesh. The monthly income of Mahesh is ₹ 26000.       (SSC Sub. Ins. 2017)
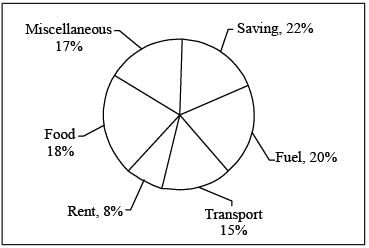
Q. Had his income been ₹ 22,000, how much less he would have spend on Miscellaneous (in ₹)? 

Detailed Solution for SSC CGL Previous Year Questions: Data Interpretation - 2 - Question 7

Here,
Income = 22,000
Spent of miscellaneous = 
When, Income = 26000
Spent of miscellaneous 
Required diffeerence = (4420 – 3740) = 680

SSC CGL Previous Year Questions: Data Interpretation - 2 - Question 8

DIRECTIONS: The pie chart given below shows the expenditure (in percentage) of Mahesh. The monthly income of Mahesh is ₹ 26000.       (SSC Sub. Ins. 2017)
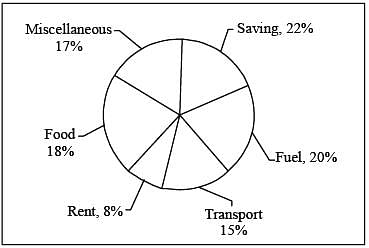
Q. If he invests 65% of his savin gs on pur chasing gold then how much amount (in ₹) does he spend on gold? 

Detailed Solution for SSC CGL Previous Year Questions: Data Interpretation - 2 - Question 8

∵ Total income = 26000
∴ Saving 
∵ Spend on gold = 65% of saving

SSC CGL Previous Year Questions: Data Interpretation - 2 - Question 9

DIRECTIONS: The pie chart given below shows the expenditure (in percentage) of Mahesh. The monthly income of Mahesh is ₹ 26000.       (SSC Sub. Ins. 2017)
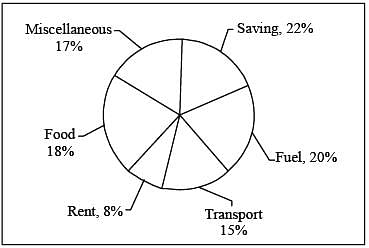
Q. What will be the approximate difference (in ₹) between the average expenditure on saving, rent and fuel and average expenditure on food, transport and savings? 

Detailed Solution for SSC CGL Previous Year Questions: Data Interpretation - 2 - Question 9

Total expenditure on saving, rent and fuel

∴ Average expenditure on saving, rent and fuel = 13000/3
Total expenditure on food, Transport and saving 
∴ Averge expenditure on food, Transport and saving = 14300/3
∴ Required difference = 

SSC CGL Previous Year Questions: Data Interpretation - 2 - Question 10

DIRECTIONS: The bar graph given below represents the total population and male population (in '000) of a city, during the period of 2013 to 2016.     (SSC Sub. Ins. 2017)
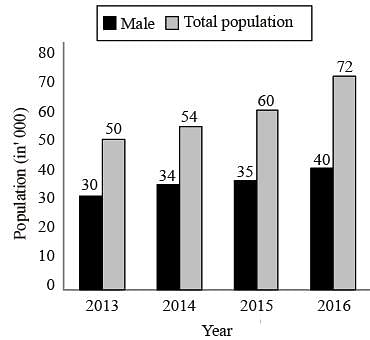
Q. What is the ratio of male and female population respectively in 2015? 

Detailed Solution for SSC CGL Previous Year Questions: Data Interpretation - 2 - Question 10

Required ratio 

SSC CGL Previous Year Questions: Data Interpretation - 2 - Question 11

DIRECTIONS: The bar graph given below represents the total population and male population (in '000) of a city, during the period of 2013 to 2016.     (SSC Sub. Ins. 2017)
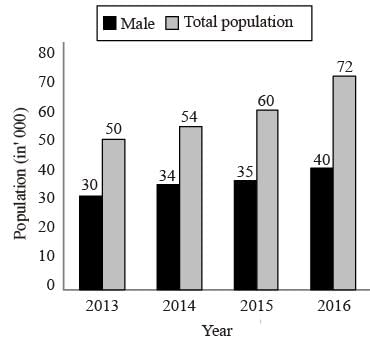
Q. In 2016 male population is how much percent more than the female population?

Detailed Solution for SSC CGL Previous Year Questions: Data Interpretation - 2 - Question 11

∵ In 2016, Male population = 40 thousands.
In 2016, Total population = 72 thousands.
∴ In 2016, female population = (72 – 40) = 32 thousands.
Required percentage 

SSC CGL Previous Year Questions: Data Interpretation - 2 - Question 12

DIRECTIONS: The bar graph given below represents the total population and male population (in '000) of a city, during the period of 2013 to 2016.     (SSC Sub. Ins. 2017)
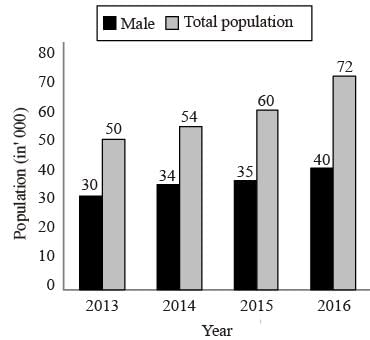
Q. In 2014 female population is what percent of total population?

Detailed Solution for SSC CGL Previous Year Questions: Data Interpretation - 2 - Question 12

Required percentage 
= 37.03%

SSC CGL Previous Year Questions: Data Interpretation - 2 - Question 13

DIRECTIONS: The bar graph given below represents the total population and male population (in '000) of a city, during the period of 2013 to 2016.     (SSC Sub. Ins. 2017)
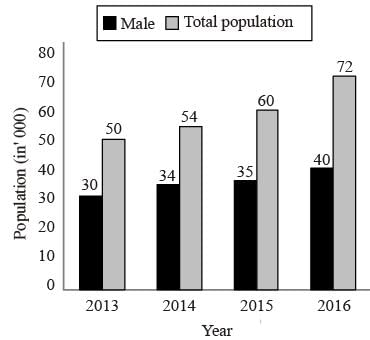
Q. Female population in 2015 is wh at per cen t of female population is 2014?

Detailed Solution for SSC CGL Previous Year Questions: Data Interpretation - 2 - Question 13

According to the graph,
In 2015, Female population = (60 – 35) = 25 thousands
In 2014, female population = (54 – 34) = 20 thousands.
∴ Required percentage 

SSC CGL Previous Year Questions: Data Interpretation - 2 - Question 14

DIRECTIONS: Refer the below data table and answer the following Question.       (SSC CHSL 2017)
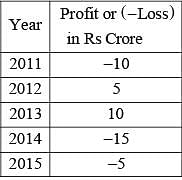
Q. What was the total Profit or Loss of the company in last 5 years? 

Detailed Solution for SSC CGL Previous Year Questions: Data Interpretation - 2 - Question 14

Loss of ₹15 crores in last 5 years.

SSC CGL Previous Year Questions: Data Interpretation - 2 - Question 15

DIRECTIONS: Refer the below data table and answer the following Question.       (SSC CHSL 2017)
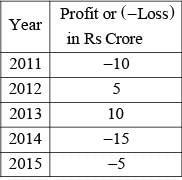
Q. Refer the below data table and answer following Question.
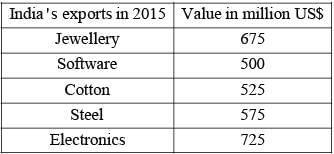
Jewellery was what percent of total exports?

Detailed Solution for SSC CGL Previous Year Questions: Data Interpretation - 2 - Question 15

Export of Jewellery in 2015 = 675
Total exports in 2015 = (675 + 500 + 525 + 575 + 725) = 3000
∴ Required percentage 

SSC CGL Previous Year Questions: Data Interpretation - 2 - Question 16

DIRECTION: Refer the below data table and answer following Question.       (SSC CHSL 2017)

Q. What is the average bonus (in rupees)?

Detailed Solution for SSC CGL Previous Year Questions: Data Interpretation - 2 - Question 16

∵ Number of employees = (3 + 8 + 4 ) = 15
∴ Total bonus of all employees

= 27 + 25.6 + 1.6 lakhs
= 54.2 lakhs.
∴ Average bonus = 

SSC CGL Previous Year Questions: Data Interpretation - 2 - Question 17

Refer the below data table and answer the following Questions:       (SSC CHSL 2017)

For which of the following pairs of years the total exports from the three Companies together are equal?

Detailed Solution for SSC CGL Previous Year Questions: Data Interpretation - 2 - Question 17

Total exports from the three companies in 2011
= 3000 + 1000 + 4000
= 8000
Total exports from the three companies in 2012
= 5000 + 1000 + 2000
= 8000
∴ option (a) is correct.

SSC CGL Previous Year Questions: Data Interpretation - 2 - Question 18

DIRECTIONS: The pie chart given below shows the percentage of time taken by different processes in making a car.       (SSC CGL 2017)
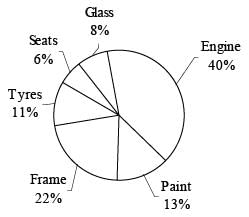
Q. If total time taken to make a car is 300 hours, then what is the total time (in hours) taken in paint and frame? 

Detailed Solution for SSC CGL Previous Year Questions: Data Interpretation - 2 - Question 18

Total time taken to make a car = 300 hours
∴ Total time taken in paint and frame = (300/100) x 35 = 105 hours.

SSC CGL Previous Year Questions: Data Interpretation - 2 - Question 19

DIRECTIONS: The pie chart given below shows the percentage of time taken by different processes in making a car.       (SSC CGL 2017)
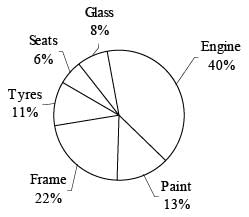
Q. If time taken in seats is 192 hours, then what is the time taken (in hours) in glass?

Detailed Solution for SSC CGL Previous Year Questions: Data Interpretation - 2 - Question 19

Total time taken in glass = (192/6) x 8 = 256 hours.

SSC CGL Previous Year Questions: Data Interpretation - 2 - Question 20

DIRECTIONS: The pie chart given below shows the percentage of time taken by different processes in making a car.       (SSC CGL 2017)
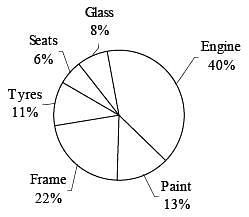
Q. If total time taken in engine and tyres is 127.5 hours, then what is the difference (in hours) in time taken by frame and glass respectively? 

Detailed Solution for SSC CGL Previous Year Questions: Data Interpretation - 2 - Question 20

∵ Total time taken in engine and tyres
= 127.5 hours
∴ Total time taken to make a car =  = 250 hours.
∴ Required difference
 hours = (55 - 20) = 35 hours.

SSC CGL Previous Year Questions: Data Interpretation - 2 - Question 21

DIRECTIONS: The pie chart given below shows the percentage of time taken by different processes in making a car.       (SSC CGL 2017)

Q. 15% of total time is spent on quality check and this time is equally taken from all other processes. So What will be the new sectorial angle (in degrees) made by total time of seats and glass? 

Detailed Solution for SSC CGL Previous Year Questions: Data Interpretation - 2 - Question 21

Time spent on quality check = 15%
As, this time is taken equally from 6 process, thus time in each process will be reduced by = 15/6 = 2.5%
Initial time taken by seats an glass = 6 + 8 = 14%
New time taken by seats and glass = (6 – 2.5) + (8 – 2.5) = 9%
∴ Sectorial angle = (9/100) x 360 = 32.4º

SSC CGL Previous Year Questions: Data Interpretation - 2 - Question 22

DIRECTIONS: The pie chart given below shows the break – up of number of hours of teaching various subjects at an institute by Mr. Raghav.       (SSC CGL 2017)
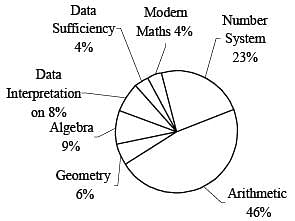
Q. If Mr. Raghav taught a total of 500 hours, then what is the difference in number of hours of teaching algebra and modern Maths?

Detailed Solution for SSC CGL Previous Year Questions: Data Interpretation - 2 - Question 22

Required difference 

SSC CGL Previous Year Questions: Data Interpretation - 2 - Question 23

DIRECTIONS: The pie chart given below shows the break – up of number of hours of teaching various subjects at an institute by Mr. Raghav.       (SSC CGL 2017)
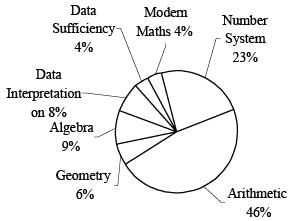
Q. Mr. Raghav taught Geometry for 36 hours. If the time taken in teaching Ratio consitutes one-fourth of the time for Arithmetic, then for how much time (in hours) did he taught the topic Ratio? 

Detailed Solution for SSC CGL Previous Year Questions: Data Interpretation - 2 - Question 23

Required time 
= 69 hours.

SSC CGL Previous Year Questions: Data Interpretation - 2 - Question 24

DIRECTIONS: The pie chart given below shows the break – up of number of hours of teaching various subjects at an institute by Mr. Raghav.       (SSC CGL 2017)
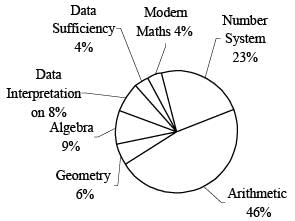
Q. If Data Interpretation and Modern Maths were taught for a combined time of 96 hours, then for how much time (in hours) were Number system and Geometry taught? 

Detailed Solution for SSC CGL Previous Year Questions: Data Interpretation - 2 - Question 24

Required time 
= 232 hours.

SSC CGL Previous Year Questions: Data Interpretation - 2 - Question 25

DIRECTIONS: The pie chart given below shows the break – up of number of hours of teaching various subjects at an institute by Mr. Raghav.       (SSC CGL 2017)
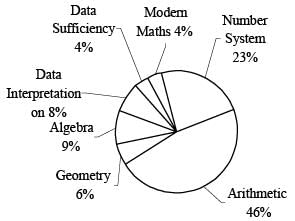
Q. A new topic named Problem Solving was also introduced and it was decided that 10% time of all topics except Arithmetic will be devoted to it. What will be the central angle (in degrees) made by Problem Solving in the new pie chart?

Detailed Solution for SSC CGL Previous Year Questions: Data Interpretation - 2 - Question 25

Required angle 
= 19.44°.

SSC CGL Previous Year Questions: Data Interpretation - 2 - Question 26

DIRECTIONS: The pie chart given below shows the number of shoes of 5 different brands in a multi brand store. There are total 1200 shoes.       (SSC CGL 2017)
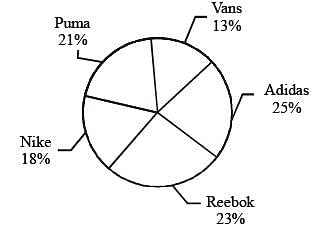
Q. How many shoes are there of Reebok brand?

Detailed Solution for SSC CGL Previous Year Questions: Data Interpretation - 2 - Question 26

Total shoes of Reebok brand = 

SSC CGL Previous Year Questions: Data Interpretation - 2 - Question 27

DIRECTIONS: The pie chart given below shows the number of shoes of 5 different brands in a multi brand store. There are total 1200 shoes.       (SSC CGL 2017)
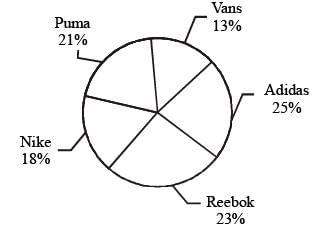
Q. What is the difference in number of shoes of Puma and Vans? 

Detailed Solution for SSC CGL Previous Year Questions: Data Interpretation - 2 - Question 27

Required difference = (21% – 13%) = 8%
= (1200 x 8)/100 = 96.

SSC CGL Previous Year Questions: Data Interpretation - 2 - Question 28

DIRECTIONS: The pie chart given below shows the number of shoes of 5 different brands in a multi brand store. There are total 1200 shoes.       (SSC CGL 2017)

Q. The difference between the number of shoes of Reebok and Nike is same as the difference between which of the following two brands? 

Detailed Solution for SSC CGL Previous Year Questions: Data Interpretation - 2 - Question 28

Difference between number of shoes of Reebok and Nike = (23 – 18) = 5%
Similarly, difference between number of shoes of Nike and Vans = (18 – 13) = 5%
So, correct answer is (c).

SSC CGL Previous Year Questions: Data Interpretation - 2 - Question 29

DIRECTIONS: The pie chart given below shows the number of shoes of 5 different brands in a multi brand store. There are total 1200 shoes.       (SSC CGL 2017)
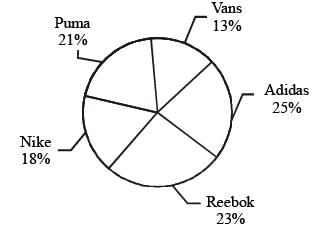
Q. Puma shoes are how much percent more than the Nike shoes? 

Detailed Solution for SSC CGL Previous Year Questions: Data Interpretation - 2 - Question 29

Required answer = 
= (3/18) x 100 = 16.66%.

SSC CGL Previous Year Questions: Data Interpretation - 2 - Question 30

DIRECTIONS: Study the following table carefully to answer these questions:        (SSC CGL 2017)
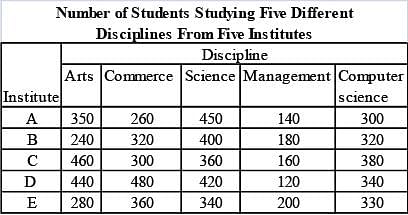
Q. What is the average number of students studying Commerce from all the Institutes together? 

Detailed Solution for SSC CGL Previous Year Questions: Data Interpretation - 2 - Question 30

Required average number

Information about SSC CGL Previous Year Questions: Data Interpretation - 2 Page
In this test you can find the Exam questions for SSC CGL Previous Year Questions: Data Interpretation - 2 solved & explained in the simplest way possible. Besides giving Questions and answers for SSC CGL Previous Year Questions: Data Interpretation - 2, EduRev gives you an ample number of Online tests for practice

Top Courses for SSC CGL

Download as PDF

Top Courses for SSC CGL