SSC CGL Previous Year Questions: Data Interpretation - 6 - SSC CGL MCQ
30 Questions MCQ Test - SSC CGL Previous Year Questions: Data Interpretation - 6
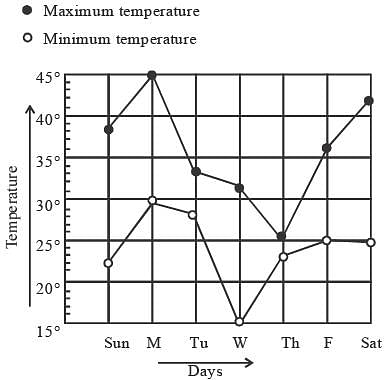
The following graph represents the maximum and minimum temperature recorded every day in a certain week. The day on which the difference between the maximum and minimum temperature was maximum is (SSC Multitasking 2013)

DIRECTIONS: The following pie-chart represents the profits earned by a certain company in seven consecutive years. Study the pie-chart carefully and answer the question. (SSC CGL 2ndSit.2012)
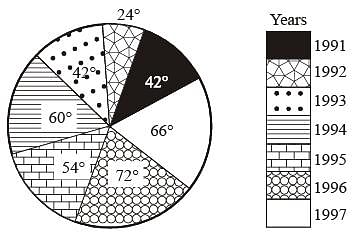
Q. The year in which the profit is nearest to the average of the profits earned in all the given years is

| 1 Crore+ students have signed up on EduRev. Have you? Download the App |
DIRECTIONS: The following pie-chart represents the profits earned by a certain company in seven consecutive years. Study the pie-chart carefully and answer the question. (SSC CGL 2ndSit.2012)
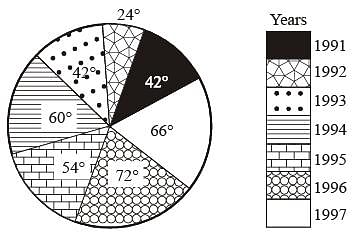
Q. If x% of the total of profits earned in all the given years is same as the profit earned in the year 1994, then x is

DIRECTIONS: The following pie-chart represents the profits earned by a certain company in seven consecutive years. Study the pie-chart carefully and answer the question. (SSC CGL 2ndSit.2012)
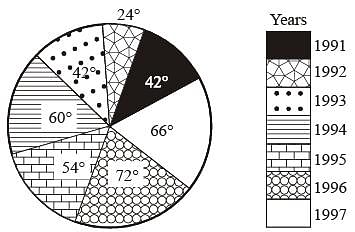
Q. If the expenditure in the year 1993 was 30% more than the expenditure in the year 1991, then the income in the year 1993 exceeds the income in the year 1991 by 30% of
DIRECTIONS: Population of five adjacent areas of a town, in the year of 2010, are represented in the following Piechart. the ratio of the numbers of males to that of females in these areas are stated in the table below. The total of the population in all the five areas is 72 lakh. Study the Pie-chart and the table and then answer the questions.
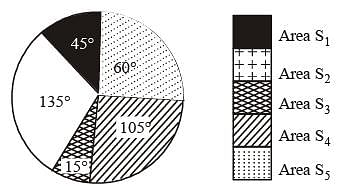
Ratio of numbers of males (M) to females (F) (SSC CGL 1st Sit. 2012)

Q. 12 lakh is the population of the area
DIRECTIONS: Population of five adjacent areas of a town, in the year of 2010, are represented in the following Piechart. the ratio of the numbers of males to that of females in these areas are stated in the table below. The total of the population in all the five areas is 72 lakh. Study the Pie-chart and the table and then answer the questions.

Ratio of numbers of males (M) to females (F) (SSC CGL 1st Sit. 2012)

Q. The number of males in the areas S1 and S4 together is
DIRECTIONS: Population of five adjacent areas of a town, in the year of 2010, are represented in the following Piechart. the ratio of the numbers of males to that of females in these areas are stated in the table below. The total of the population in all the five areas is 72 lakh. Study the Pie-chart and the table and then answer the questions.

Ratio of numbers of males (M) to females (F) (SSC CGL 1st Sit. 2012)

Q. The ratio of number of females in the area S2 to that in the area S5 is
DIRECTIONS: Population of five adjacent areas of a town, in the year of 2010, are represented in the following Piechart. the ratio of the numbers of males to that of females in these areas are stated in the table below. The total of the population in all the five areas is 72 lakh. Study the Pie-chart and the table and then answer the questions.

Ratio of numbers of males (M) to females (F) (SSC CGL 1st Sit. 2012)

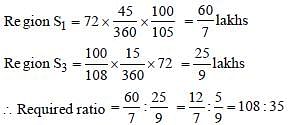
Q. If, in the year 2010, there was an increase of 5% population in the area S1 and 8% increase in population of the area S3 compared to the previous year, then the ratio of population in the areas S1 and S3, in the year 2009 was
DIRECTIONS: Population of five adjacent areas of a town, in the year of 2010, are represented in the following Piechart. the ratio of the numbers of males to that of females in these areas are stated in the table below. The total of the population in all the five areas is 72 lakh. Study the Pie-chart and the table and then answer the questions.

Ratio of numbers of males (M) to females (F) (SSC CGL 1st Sit. 2012)

Q. The aver age of female population in all the five areas is lower than the female population in each of the areas
DIRECTIONS: The number of mobile simcards in 4 states are given in multiple bar diagrams. Study the diagram and answer the questions below. (SSC CGL 2nd Sit.2012)
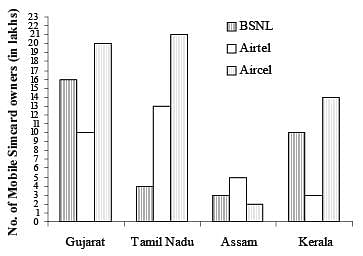
Q. In Assam, the ratio of Air cell simcard and Airtel simcard sold is:
DIRECTIONS: The number of mobile simcards in 4 states are given in multiple bar diagrams. Study the diagram and answer the questions below. (SSC CGL 2nd Sit.2012)
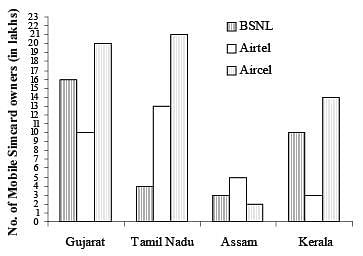
Q. In which state are there the largest number of owners of Airtel simcard?
DIRECTIONS: The number of mobile simcards in 4 states are given in multiple bar diagrams. Study the diagram and answer the questions below. (SSC CGL 2nd Sit.2012)
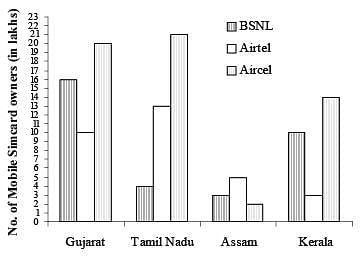
Q. Average of simcard sold in the four states in lakhs is
DIRECTIONS: The number of mobile simcards in 4 states are given in multiple bar diagrams. Study the diagram and answer the questions below. (SSC CGL 2nd Sit.2012)
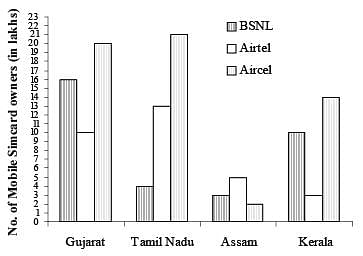
Q. The range of BSNL simcard sold in the 4 states in lakhs is:
DIRECTIONS: The number of mobile simcards in 4 states are given in multiple bar diagrams. Study the diagram and answer the questions below. (SSC CGL 2nd Sit.2012)
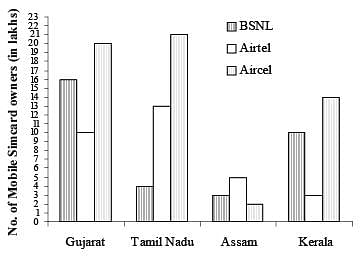
Q. Of all the simcards sold in all the four states, the number of simcards sold in Gujarat is (approx)
DIRECTIONS: The graph shows Income and Expenditure of a company. Study the graph and answer the questions. (SSC CGL 1st Sit.2012)
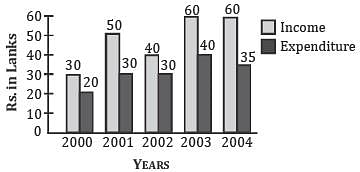
Q. The number of years in which the income exceeds the average income is
DIRECTIONS: The graph shows Income and Expenditure of a company. Study the graph and answer the questions. (SSC CGL 1st Sit.2012)
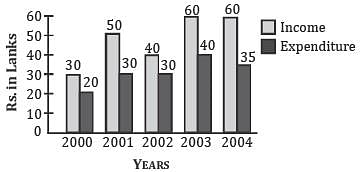
Q. The difference in profit between 2001 and 2002 is
DIRECTIONS: The graph shows Income and Expenditure of a company. Study the graph and answer the questions. (SSC CGL 1st Sit.2012)
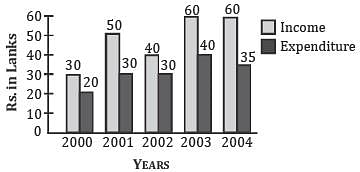
Q. The profit was maximum in the year
DIRECTIONS: The graph shows Income and Expenditure of a company. Study the graph and answer the questions. (SSC CGL 1st Sit.2012)
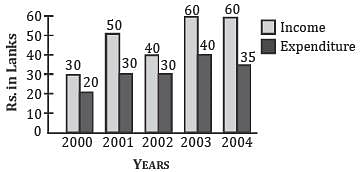
Q. The income in 2002 was equal to the expenditure in the year
DIRECTIONS: The graph shows Income and Expenditure of a company. Study the graph and answer the questions. (SSC CGL 1st Sit.2012)
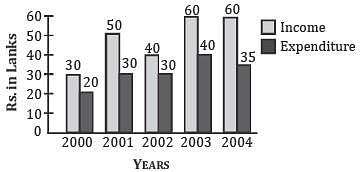
Q. The expenditure from 2002 to 2003 increased by
DIRECTIONS: Study the graph and answer the questions that follows :
Circle graph given below shows the expenditure incurred in bringing out a book by a publisher. (SSC CHSL 2012)
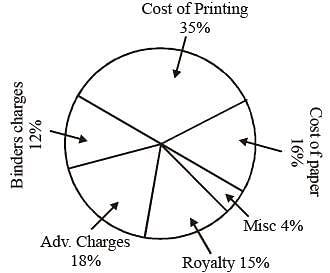
Q. The central angle of the sector for the cost of the paper is :
DIRECTIONS: Study the graph and answer the questions that follows :
Circle graph given below shows the expenditure incurred in bringing out a book by a publisher. (SSC CHSL 2012)
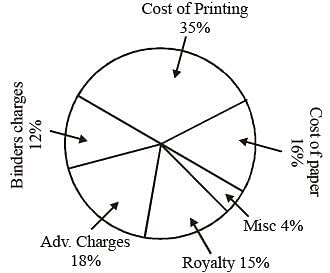
Q. Royalty on the book is less than the Advertisement charges by:
DIRECTIONS: Study the graph and answer the questions that follows :
Circle graph given below shows the expenditure incurred in bringing out a book by a publisher. (SSC CHSL 2012)
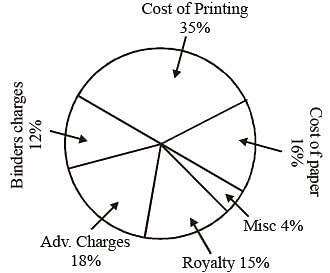
Q. If 5500 copies are published, Miscellaneous expenditures amounts to ₹ 1848 and publisher’s profit is 25%, then marked price of each copy is :
DIRECTIONS: Study the graph and answer the questions that follows :
Circle graph given below shows the expenditure incurred in bringing out a book by a publisher. (SSC CHSL 2012)
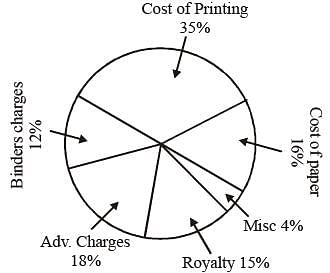
Q. If the cost of printing is ₹ 17,500, the Royalty is:
DIRECTIONS: Study the graph and answer the questions that follows :
Circle graph given below shows the expenditure incurred in bringing out a book by a publisher. (SSC CHSL 2012)
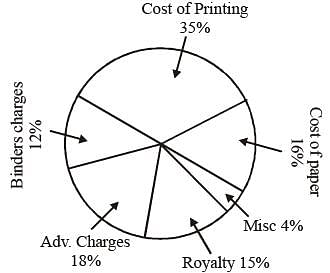
Q. If the Miscellaneous charges is ₹ 6,000, the Advertisement charges are:
DIRECTIONS: Read the following chart and answer the questions that follows :
The following pie-chart shows the preference of musical instruments of 60,000 people surveyed over whole India. (SSC CHSL 2012)
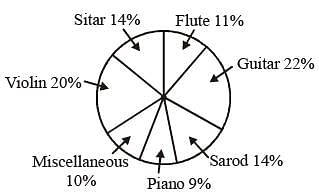
Q. The number of people who prefer Guitar is greater than the total number of people who prefer either Flute or Piano by :
DIRECTIONS: Read the following chart and answer the questions that follows :
The following pie-chart shows the preference of musical instruments of 60,000 people surveyed over whole India. (SSC CHSL 2012)
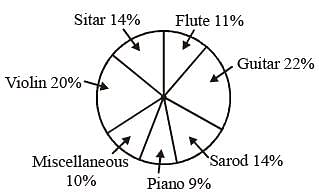
Q. If 16(2/3)% of the people who prefer Piano, would go with the people who prefers Flute, the percentage of people who prefer Flute would have been :
DIRECTIONS: Read the following chart and answer the questions that follows :
The following pie-chart shows the preference of musical instruments of 60,000 people surveyed over whole India. (SSC CHSL 2012)
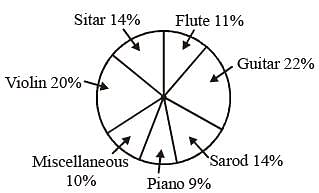
Q. The number of people who prefer the musical instrument Sarod is :
DIRECTIONS: Read the following chart and answer the questions that follows :
The following pie-chart shows the preference of musical instruments of 60,000 people surveyed over whole India. (SSC CHSL 2012)
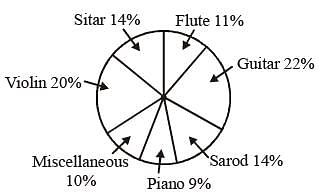
Q. The total number of people who prefer either Sarod or Guitar, is greater than the total number of people who prefer either Violin or Sitar by :
DIRECTIONS: Read the following chart and answer the questions that follows :
The following pie-chart shows the preference of musical instruments of 60,000 people surveyed over whole India. (SSC CHSL 2012)
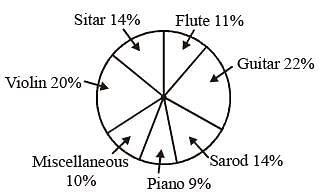
Q. If 2100 people be less from the number of people who prefer Flute, the percentage of people who prefer Flute would have been:
DIRECTIONS: The pie-chart given below shows the distribution of workforce by occupational category for country X in 1981 and 1995. Study the chart and answer the questions no. 15 to 19. (SSC Sub. Ins. 2012)
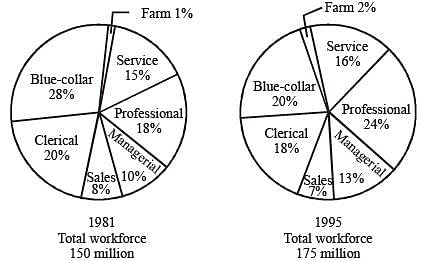
Q. The percentage decrease in the number of Blue-Collar workers in the workforce of country X from 1981 to 1995 is



 5.34 lakhs


