Test: ACT Biology Data Representation Questions - ACT MCQ
10 Questions MCQ Test - Test: ACT Biology Data Representation Questions
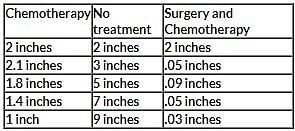
The table above shows measurements for tumor size growth over time within three different possible treatment methods. Each tumor was first documented at an initial size of 2 inches. Every month each tumor was measured, for a total of five measurements of each tumor.
Q. What conclusion CANNOT be reached based on the data shown above?


The table above shows measurements for tumor size growth over time within three different possible treatment methods. Each tumor was first documented at an initial size of 2 inches. Every month each tumor was measured, for a total of five measurements of each tumor.
Q. What information would be most important to know before drawing conclusions based on this data?

| 1 Crore+ students have signed up on EduRev. Have you? Download the App |

The table above shows measurements for tumor size growth over time within three different possible treatment methods. Each tumor was first documented at an initial size of 2 inches. Every month each tumor was measured, for a total of five measurements of each tumor.
Q. Looking at the "Surgery and Chemotherapy" treatment column, where could one infer that chemotherapy was performed?


The table above shows measurements for tumor size growth over time within three different possible treatment methods. Each tumor was first documented at an initial size of 2 inches. Every month each tumor was measured, for a total of five measurements of each tumor.
Q. Based on the chart above, what conclusion could be drawn about the "no treatment" option?

The table above shows measurements for tumor size growth over time within three different possible treatment methods. Each tumor was first documented at an initial size of 2 inches. Every month each tumor was measured, for a total of five measurements of each tumor.
Q. Based on the table above, which single method is most effective at reducing tumor size in the shortest period of time?
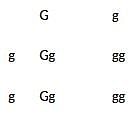
Scientist’s believe they have found the gene accountable for intelligence. The allele “G” is dominant, and the allele “g” is recessive. The intelligence gene is optimally expressed in the homozygous recessive form. The chart above shows the trait in the heterozygous form and the homozygous form. The form “gg” is from the mother, and “Gg” is from the father. The parents want to know what the gene might look like in their child.
Q. What form of the gene expresses optimal intelligence?
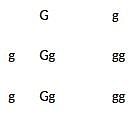
Scientist’s believe they have found the gene accountable for intelligence. The allele “G” is dominant, and the allele “g” is recessive. The intelligence gene is optimally expressed in the homozygous recessive form. The chart above shows the trait in the heterozygous form and the homozygous form. The form “gg” is from the mother, and “Gg” is from the father. The parents want to know what the gene might look like in their child.
Q. According to the data given, what could one infer about the phenotype for "Gg?"
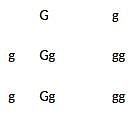
Scientist’s believe they have found the gene accountable for intelligence. The allele “G” is dominant, and the allele “g” is recessive. The intelligence gene is optimally expressed in the homozygous recessive form. The chart above shows the trait in the heterozygous form and the homozygous form. The form “gg” is from the mother, and “Gg” is from the father. The parents want to know what the gene might look like in their child.
Q. According to the chart above, what are the chances of the child inheriting the optimal form of the gene?
A new drug is in its clinical trial phase. The graph below shows the data for participants sleep patterns before medication use and then after using the medication for three months. Series 1 shows the average hours slept a night for each participant prior to medication. Series 2 shows the average hours slept a night for each participant after three months of use. The average hours slept a night was obtained by recording sleep every night for one month, and then finding the average. Patients one through five took a placebo pil, not the actual Moonlight medication. Note: The y-axis is measured in hours slept a night, while the x-axis lists each anonymous patient numerically.
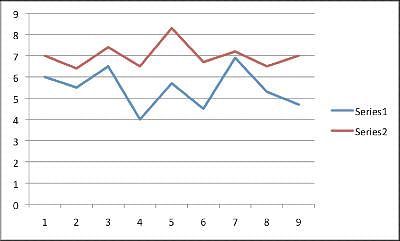
Q. The overall trend when comparing sleep before and after mediciation use is __________.
A new drug is in its clinical trial phase. The graph below shows the data for participants sleep patterns before medication use and then after using the medication for three months. Series 1 shows the average hours slept a night for each participant prior to medication. Series 2 shows the average hours slept a night for each participant after three months of use. The average hours slept a night was obtained by recording sleep every night for one month, and then finding the average. Patients one through five took a placebo pil, not the actual Moonlight medication. Note: The y-axis is measured in hours slept a night, while the x-axis lists each anonymous patient numerically.
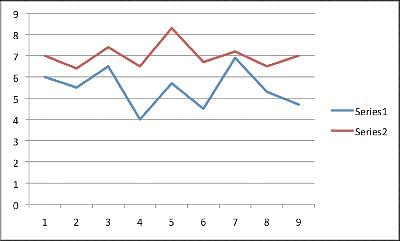
Q. What information would strengthen the experiment?


