UCAT Exam  >  UCAT Test  >  Quantitative Reasoning  >  Test: Tables - 1 - UCAT MCQ

Tables - 1 - UCAT Quant Reasoning Free MCQ Test with solutions


MCQ Practice Test & Solutions: Test: Tables - 1 (20 Questions)

You can prepare effectively for UCAT Quantitative Reasoning for UCAT with this dedicated MCQ Practice Test (available with solutions) on the important topic of "Test: Tables - 1". These 20 questions have been designed by the experts with the latest curriculum of UCAT 2026, to help you master the concept.

Test Highlights:

  • - Format: Multiple Choice Questions (MCQ)
  • - Duration: 13 minutes
  • - Number of Questions: 20

Sign up on EduRev for free to attempt this test and track your preparation progress.

Test: Tables - 1 - Question 1

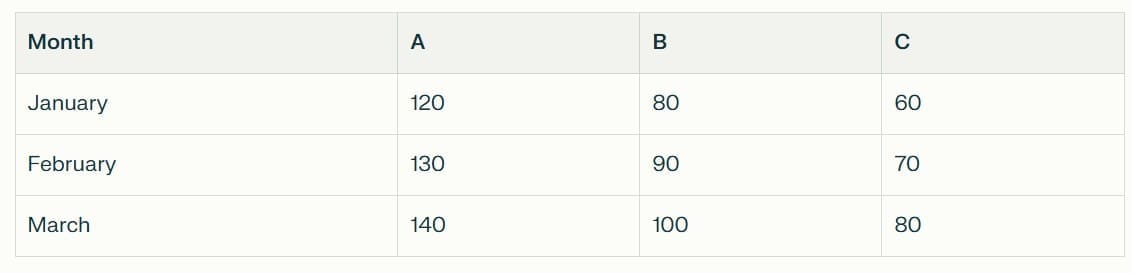
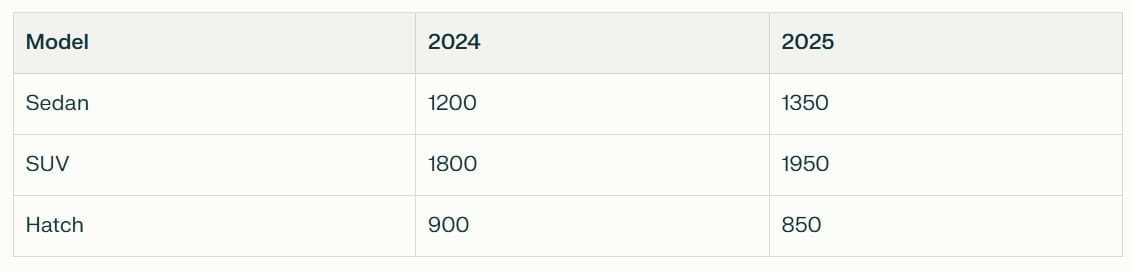
The table below shows monthly sales (in £000s) for a store across products A, B, and C in 2024.

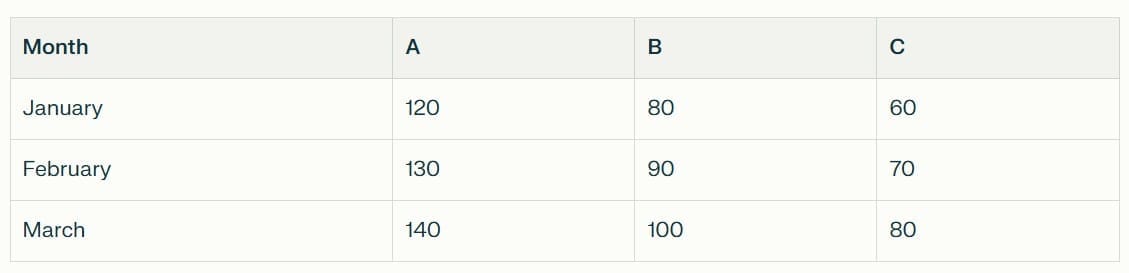
What was the total sales for product B in the first quarter?

Detailed Solution: Question 1

First quarter means January, February, and March.
Sales for product B:
January: 80
February: 90
March: 100
Total in £000s = 80 + 90 + 100 = 270 (£000s).
Since the figures are in thousands, total sales = £270,000.
So the correct option is £270,000 → Option B.

Test: Tables - 1 - Question 2

 By what percentage did product A sales increase from January to March?

Detailed Solution: Question 2

Product A sales:
January: 120
March: 140
Increase = 140 − 120 = 20 (£000s).
Percentage increase
= (Increase / Original) × 100
= (20 / 120) × 100
= (1 / 6) × 100
≈ 16.67%.
Rounded to one decimal place, this is 16.7%, which matches Option B.

Test: Tables - 1 - Question 3

 What was the average monthly sales across all products in February?

Detailed Solution: Question 3

In February, sales (in £000s):
A: 130
B: 90
C: 70
Total February sales in £000s
= 130 + 90 + 70
= 290 (£000s).
Interpreting the question as asking for the overall February sales across all products, we get £290,000.
So the correct option is £290,000 → Option D.

Test: Tables - 1 - Question 4

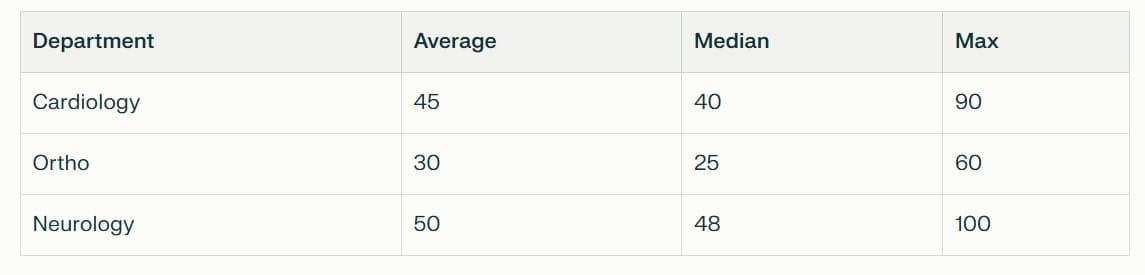
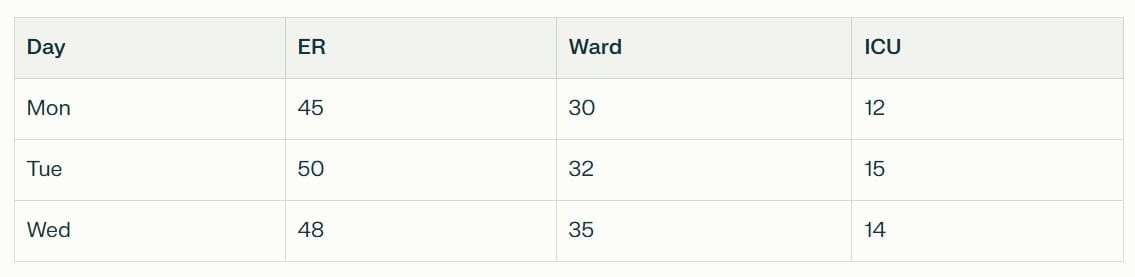
Which department had the highest difference between average and median wait time?

Detailed Solution: Question 4

Compute the difference (Average − Median) for each department:
Cardiology: 45 − 40 = 5 minutes
Ortho: 30 − 25 = 5 minutes
Neurology: 50 − 48 = 2 minutes
Cardiology and Ortho both have the same highest difference of 5 minutes.
So the departments with the highest difference are equal → Option D.

Test: Tables - 1 - Question 5

If max wait is excluded, estimate the average for Neurology (assuming median reflects typical).

Detailed Solution: Question 5

The maximum wait time (100 minutes) is an outlier and would drag the average up.
When outliers are excluded, the median is usually a better estimate of the “typical” value.
For Neurology, the median wait time is 48 minutes.
So the best estimate of the average without the max is 48 minutes → Option A.

Test: Tables - 1 - Question 6

What was the percentage increase in revenue from Q1 to Q4?

Detailed Solution: Question 6

Q1 revenue = 5.2 million
Q4 revenue = 7.0 million
Increase = 7.0 − 5.2 = 1.8 million
Percentage increase
= (Increase / Original) × 100
= (1.8 / 5.2) × 100
≈ 0.34615 × 100
≈ 34.6%.
So the correct option is 34.6% → Option B.

Test: Tables - 1 - Question 7

What is the median quarterly revenue?

Detailed Solution: Question 7

List the quarterly revenues in ascending order:
5.2, 5.8, 6.1, 7.0
With four values, the median is the average of the 2nd and 3rd values:
Median = (5.8 + 6.1) / 2
= 11.9 / 2
= 5.95 million.
Rounded to one decimal place, 5.95 ≈ 6.0 million.
So the closest option is £6.0m → Option B.

Test: Tables - 1 - Question 8

Who had the highest average score?

Detailed Solution: Question 8

Calculate the average for each student:
Alice:
Total = 85 + 92 + 88 = 265
Average = 265 / 3 ≈ 88.3
Bob:
Total = 78 + 85 + 82 = 245
Average = 245 / 3 ≈ 81.7
Carol:
Total = 90 + 88 + 95 = 273
Average = 273 / 3 = 91.0
Carol has the highest average score (91).
So the correct answer is Carol → Option C.

Test: Tables - 1 - Question 9

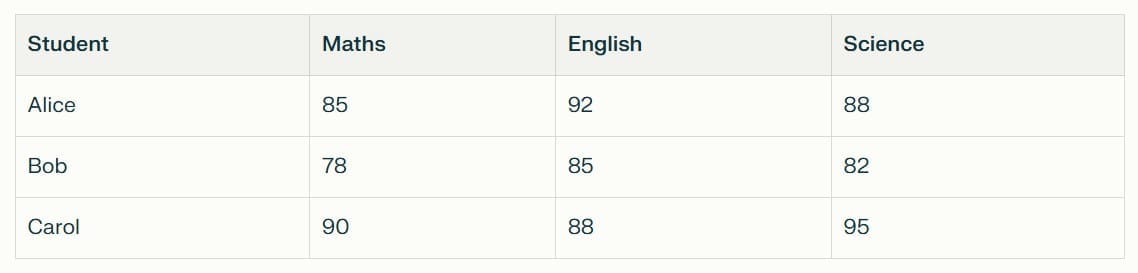
By what percentage is Carol's Maths score of her Science score,where, maths score is 90 and science score is 95?


Detailed Solution: Question 9

Carol’s scores:
Maths = 90
Science = 95
We want Maths as a percentage of Science:
Percentage
= (Maths / Science) × 100
= (90 / 95) × 100
≈ 0.9474 × 100
≈ 94.7%.
So the correct option is 94.7% → Option B.

Test: Tables - 1 - Question 10

Total patients on Tuesday exceeded Monday by what percent?

Detailed Solution: Question 10

Total patients:
Monday:
= 45 (ER) + 30 (Ward) + 12 (ICU)
= 87
Tuesday:
= 50 (ER) + 32 (Ward) + 15 (ICU)
= 97
Increase from Monday to Tuesday
= 97 − 87 = 10 patients
Percentage increase
= (Increase / Monday total) × 100
= (10 / 87) × 100
≈ 0.1149 × 100
≈ 11.5%.
Among the options, 12.5% is the closest to 11.5%.
So we choose Option C.

Test: Tables - 1 - Question 11

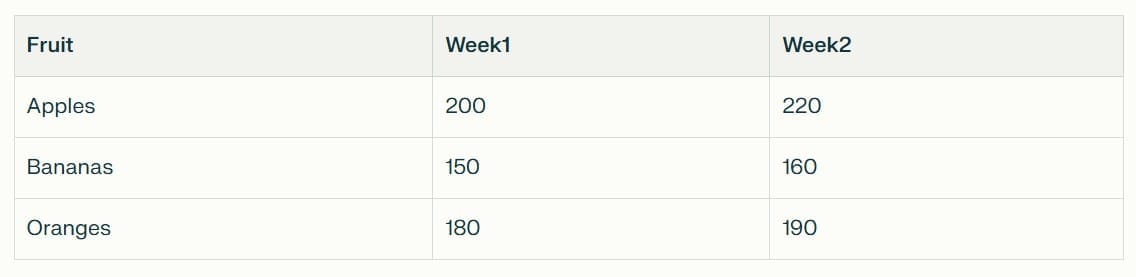
Sales data for fruits (units sold).

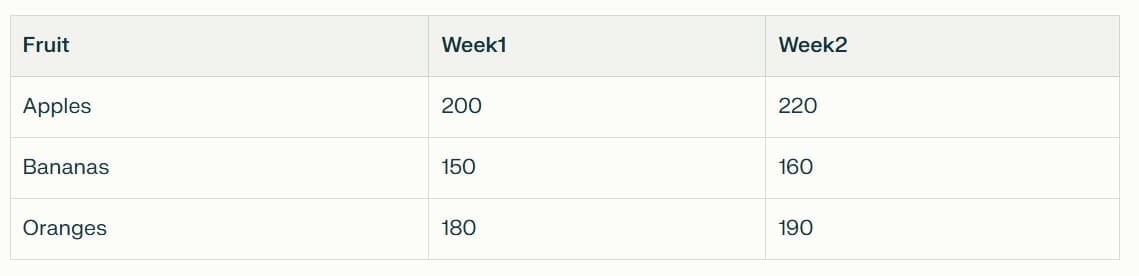
Total sales increased by what % from Week1 to Week2?

Detailed Solution: Question 11

Total Week 1 sales:
= 200 + 150 + 180
= 530 units
Total Week 2 sales:
= 220 + 160 + 190
= 570 units
Increase = 570 − 530 = 40 units
Percentage increase
= (40 / 530) × 100
≈ 0.07547 × 100
≈ 7.55%.
Compare with options:
5.7% (difference ≈ 1.85)
6.7% (difference ≈ 0.85)
10% (difference ≈ 2.45)
12% (difference ≈ 4.45)
The closest is 6.7% → Option B.

Test: Tables - 1 - Question 12

Which fruit had the highest % increase?

Detailed Solution: Question 12

Percentage increase for each fruit:
Apples:
Increase = 220 − 200 = 20
Percentage = (20 / 200) × 100 = 10%
Bananas:
Increase = 160 − 150 = 10
Percentage = (10 / 150) × 100 ≈ 6.67%
Oranges:
Increase = 190 − 180 = 10
Percentage = (10 / 180) × 100 ≈ 5.56%
Highest percentage increase is for Apples (10%).
So the correct answer is Apples → Option A.

Test: Tables - 1 - Question 13

Budget table (£000s) for dept.

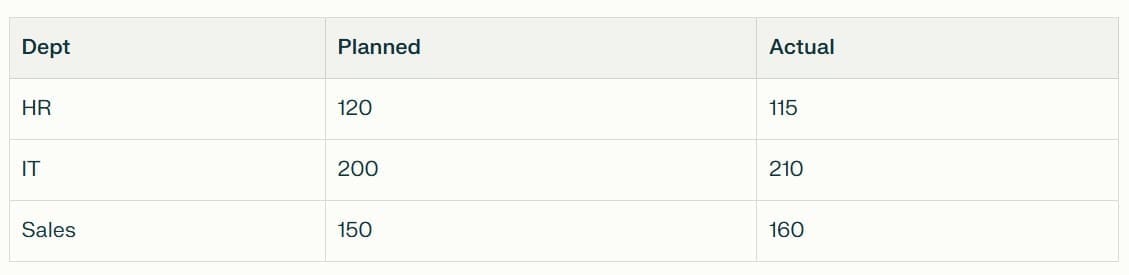
Which department had the largest % variance (actual vs planned)?

Detailed Solution: Question 13

We calculate the absolute percentage difference between planned and actual.
HR:
Difference = 120 − 115 = 5
% variance = (5 / 120) × 100 ≈ 4.17%
IT:
Difference = 210 − 200 = 10
% variance = (10 / 200) × 100 = 5%
Sales:
Difference = 160 − 150 = 10
% variance = (10 / 150) × 100 ≈ 6.67%
Sales has the largest percentage variance.
So the correct answer is Sales → Option C.

Test: Tables - 1 - Question 14

Temp data (°C) cities.

London's range (Jul − Jan) is:

Detailed Solution: Question 14

Range for London = July temperature − January temperature
= 22 − 5
= 17°C.
So the correct answer is 17°C → Option B.

Test: Tables - 1 - Question 15

What is the average July temperature across the three cities?

Detailed Solution: Question 15

July temperatures:
London: 22°C
Paris: 24°C
Berlin: 23°C
Average July temperature
= (22 + 24 + 23) / 3
= 69 / 3
= 23°C.
So the correct answer is 23°C → Option B.

Test: Tables - 1 - Question 16

Car sales by model.

What were the total 2025 sales?

Detailed Solution: Question 16

Total 2025 sales = Sedan + SUV + Hatch
= 1350 + 1950 + 850
First add Sedan and SUV:
1350 + 1950 = 3300
Then add Hatch:
3300 + 850 = 4150
So total 2025 sales are 4,150 units → Option B.

Test: Tables - 1 - Question 17

What percentage of total 2024 sales were SUVs?

Detailed Solution: Question 17

Total 2024 sales:
= 1200 (Sedan) + 1800 (SUV) + 900 (Hatch)
= 1200 + 1800 + 900
= 3900
SUV sales 2024 = 1800
Percentage of total
= (1800 / 3900) × 100
≈ 0.4615 × 100
≈ 46.15%.
Compare with options:
50% (difference ≈ 3.85)
55% (difference ≈ 8.85)
60% (difference ≈ 13.85)
65% (difference ≈ 18.85)
The closest is 50% → Option A.

Test: Tables - 1 - Question 18

Flight delays (mins) by airline.

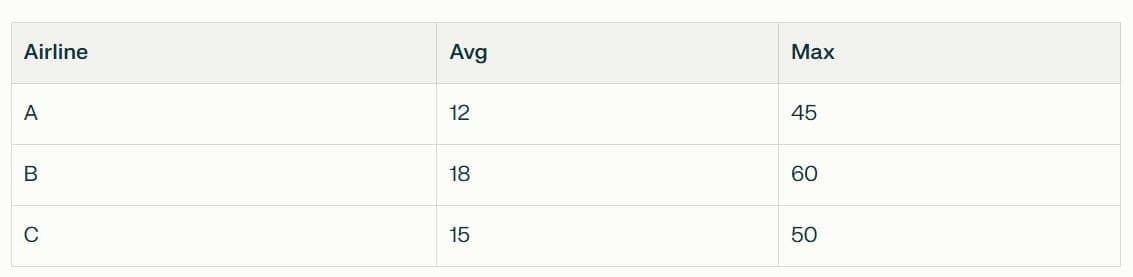
Which airline has the highest max/avg ratio?

Detailed Solution: Question 18

Compute Max / Avg for each airline:
Airline A:
= 45 / 12
= 3.75
Airline B:
= 60 / 18
= 3.33...
Airline C:
= 50 / 15
≈ 3.33...
The largest ratio is for Airline A (3.75).
So the correct answer is Airline A → Option A.

Test: Tables - 1 - Question 19

What was the combined Friday production?

Detailed Solution: Question 19

Friday production:
North: 280 units
South: 320 units
Combined Friday production
= 280 + 320
= 600 units.
So the correct answer is 600 → Option B.

Test: Tables - 1 - Question 20

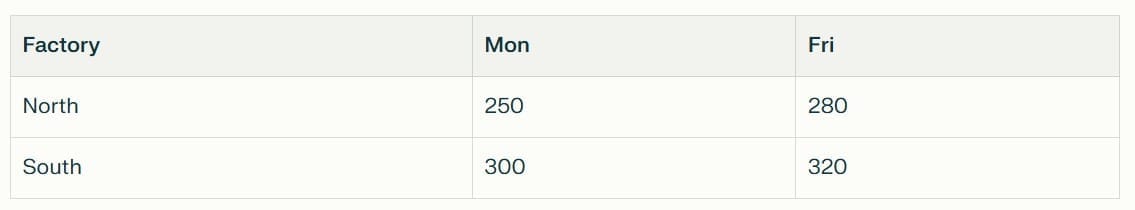
What was the percentage increase in North factory production from Monday to Friday?

Detailed Solution: Question 20

North factory:
Monday = 250 units
Friday = 280 units
Increase = 280 − 250 = 30 units
Percentage increase
= (Increase / Monday value) × 100
= (30 / 250) × 100
= 0.12 × 100
= 12%.
So the correct answer is 12% → Option B.

38 videos|50 docs|24 tests
Information about Test: Tables - 1 Page
In this test you can find the Exam questions for Test: Tables - 1 solved & explained in the simplest way possible. Besides giving Questions and answers for Test: Tables - 1, EduRev gives you an ample number of Online tests for practice
Download as PDF