MCQ Test: Radar Graph Caselet - 1 - Banking Exams MCQ
20 Questions MCQ Test - MCQ Test: Radar Graph Caselet - 1

Study the following graph carefully to answer the questions that follow.
Number of Students (In thousands) in Two Different Universities in Six Different Years

Q. What was the difference between the number of students in university 1 in the year 2010 and the number of students in university 2 in year 2012?
Study the following graph carefully to answer the questions that follow.
Number of Students (In thousands) in Two Different Universities in Six Different Years

Q. In which year was the difference between the number of students in university 1 and the number of students in university 2 highest?
| 1 Crore+ students have signed up on EduRev. Have you? Download the App |
Study the following graph carefully to answer the questions that follow.
Number of Students (In thousands) in Two Different Universities in Six Different Years

Q. What is the sum of the number of students in university 1 in the year 2007 and the number of students in university 2 in the year 2011 together?
Study the following graph carefully to answer the questions that follow.
Number of Students (In thousands) in Two Different Universities in Six Different Years

Q. What was the per cent increase in the number of students in university 1 in the year 2011 as compared to the previous year?
Study the following graph carefully to answer the questions that follow.
Number of Students (In thousands) in Two Different Universities in Six Different Years
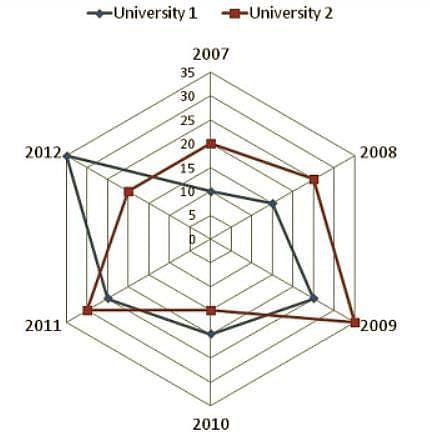
Q. If 25% of the students in university 2 in the year 2010 were females, what was the number of male students in the university 2 in the same year?

Directions: Pie chart given below shows the percentage distribution of the number of tourists who visited five different places namely Red Fort, Taj Mahal, India Gate, Agra Fort and Qutub Minar in a particular day.
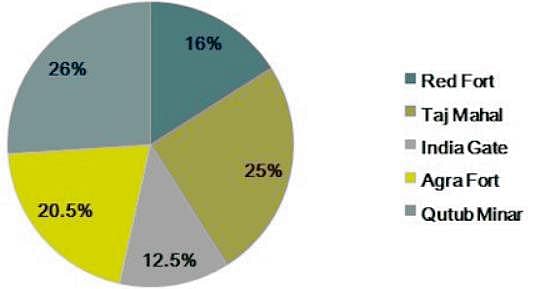
Note: Difference between the number of tourists who visited Agra Fort and Qutub Minar is 176.
Q. If 36% of total number of tourists who visited Taj Mahal and 58% of total number of tourists who visited India Gate are female tourists, then find the sum of the number of male tourists who visited Taj mahal and India Gate?
Directions: Pie chart given below shows the percentage distribution of the number of tourists who visited five different places namely Red Fort, Taj Mahal, India Gate, Agra Fort and Qutub Minar in a particular day.

Note: Difference between the number of tourists who visited Agra Fort and Qutub Minar is 176.
Q. If the ratio of the number of male to female tourists who visited Red Fort is 53: 75, then find the difference between the number of male and female tourists who visited Red Fort?
Directions: Pie chart given below shows the percentage distribution of the number of tourists who visited five different places namely Red Fort, Taj Mahal, India Gate, Agra Fort and Qutub Minar in a particular day.
Note: Difference between the number of tourists who visited Agra Fort and Qutub Minar is 176.
Q. Find the average number of tourists who visited Agra Fort and Qutub Minar?
Directions: Pie chart given below shows the percentage distribution of the number of tourists who visited five different places namely Red Fort, Taj Mahal, India Gate, Agra Fort and Qutub Minar in a particular day.
Note: Difference between the number of tourists who visited Agra Fort and Qutub Minar is 176.
Q. If the number of child tourists who visited India Gate is 160 less than the number of adult tourists who visited India Gate, then find the number of child tourists who visited India Gate is what percent of a total number of tourists who visited India Gate, if only child tourists and adult tourists visited India Gate?
Directions: Pie chart given below shows the percentage distribution of the number of tourists who visited five different places namely Red Fort, Taj Mahal, India Gate, Agra Fort and Qutub Minar in a particular day.
Note: Difference between the number of tourists who visited Agra Fort and Qutub Minar is 176.
Q. Find the ratio of the number of tourists who visited Taj Mahal and those who visited Agra Fort and Qutub Minar together?
Directions: Study the following graph carefully to answer the questions that follow.
Number of new companies registered (in thousand) in four countries in various years

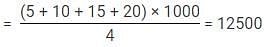
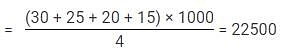
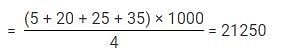
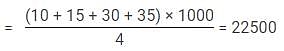
Q. In which year is the average of the number of companies registered the maximum?


Directions: Study the following graph carefully to answer the questions that follow.
Number of new companies registered (in thousand) in four countries in various years
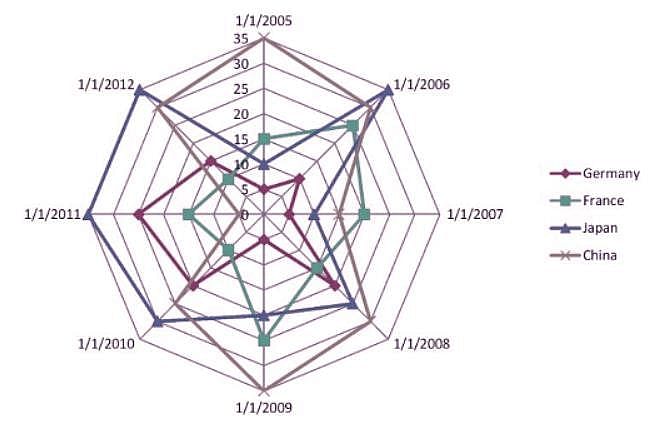
Q. The total number of companies registered in France is how much more or less than the total number of companies registered in China?

Directions: Study the following graph carefully to answer the questions that follow.
Number of new companies registered (in thousand) in four countries in various years

Q. The number of companies registered in 2012 is what percentage more or less than the number of companies registered in the year 2005?

Directions: Study the following graph carefully to answer the questions that follow.
Number of new companies registered (in thousand) in four countries in various years
Q. What is the ratio of the number companies registered in Japan to that in China during 2005 to 2012?
Directions: Study the following graph carefully to answer the questions that follow.
Number of new companies registered (in thousand) in four countries in various years
Q. In which of country is the average number of companies registered the maximum?


Directions: Following line graph shows the ratio of import to the export of two companies A and B over the years 1994-1999. Answer the questions based on this graph.

Q. What is the ratio of import to export of Company B in year 1994 and the ratio of export to import of Company A in year 1997?

Directions: Following line graph shows the ratio of import to the export of two companies A and B over the years 1994-1999. Answer the questions based on this graph.

Q. If the import of Company A is Rs 48 lakhs in year 1997 then what is its export in that year?

Directions: Following line graph shows the ratio of import to the export of two companies A and B over the years 1994-1999. Answer the questions based on this graph.
Q. What is the ratio of the number of years in which Company A’s export is less than import and the number of years in which Company B’s import is less than export?
Directions: Following line graph shows the ratio of import to the export of two companies A and B over the years 1994-1999. Answer the questions based on this graph.
Q. If the export of Company A in 1996 and export of Company B in 1997 is 75 lakhs each, then the import of Company A in 1996 is what percent of the import of Company B in 1997?
Directions: Following line graph shows the ratio of import to the export of two companies A and B over the years 1994-1999. Answer the questions based on this graph.
Q. If the import of Company B is 60 lakhs in 1998, then what is the export of Company A in the same year?
Top Courses for Banking Exams


Important Questions for MCQ Test: Radar Graph Caselet - 1
MCQ Test: Radar Graph Caselet - 1
Online Tests for MCQ Test: Radar Graph Caselet - 1
|
© EduRev
|
Education Revolution
|


|


