MCQ Test: Line Graph - 1 - Banking Exams MCQ
20 Questions MCQ Test - MCQ Test: Line Graph - 1

The given Line graph Data Interpretation Chart shows the sales of shoes (in thousands) from six stores in six different cities Kolkata, Patna, Dhanbad, Ranchi, Asansol, and Gaya during three consecutive years 2014, 2015 and 2016.
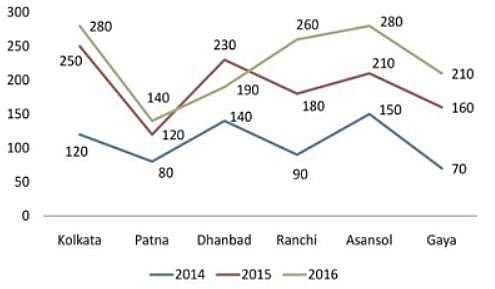
Q. What is the ratio of the total sales of Patna store for three years to the total sales of Asansol store for three years?
The given Line graph Data Interpretation Chart shows the sales of shoes (in thousands) from six stores in six different cities Kolkata, Patna, Dhanbad, Ranchi, Asansol, and Gaya during three consecutive years 2014, 2015 and 2016.

Q. What is the total number of Campus shoes sales of store Kolkata, store Patna and store Ranchi together for three years?
| 1 Crore+ students have signed up on EduRev. Have you? Download the App |
The given Line graph Data Interpretation Chart shows the sales of shoes (in thousands) from six stores in six different cities Kolkata, Patna, Dhanbad, Ranchi, Asansol, and Gaya during three consecutive years 2014, 2015 and 2016.
Q. Total number of Campus shoes sales on Gaya store and Patna store together for three years is what percent of the total sales of Dhanbad store and Ranchi store together for three years?
The given Line graph Data Interpretation Chart shows the sales of shoes (in thousands) from six stores in six different cities Kolkata, Patna, Dhanbad, Ranchi, Asansol, and Gaya during three consecutive years 2014, 2015 and 2016.
Q. What is the ratio of average sales of Campus shoes of all the stores for the year 2014 to average sales of Campus shoes of all the stores for the year 2015?


The given Line graph Data Interpretation Chart shows the sales of shoes (in thousands) from six stores in six different cities Kolkata, Patna, Dhanbad, Ranchi, Asansol, and Gaya during three consecutive years 2014, 2015 and 2016.
Q. What percent of the average sales of Campus shoes on Kolkata store, Patna store and Dhanbad store in 2014 is the average sales of Campus shoes on Ranchi store, Asansol store and Gaya store in 2015?
Directions: The following line – graph gives the ratio of the amounts of imports by a company to the amount of exports from that company over the period from 2005 to 2011.
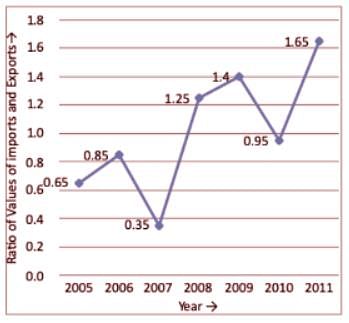
Q. What was the percentage increase in imports from 2007 to 2008?
Directions: The following line – graph gives the ratio of the amounts of imports by a company to the amount of exports from that company over the period from 2005 to 2011.

Q. In how many of the given years were the exports more than the imports?

Directions: The following line – graph gives the ratio of the amounts of imports by a company to the amount of exports from that company over the period from 2005 to 2011.

Q. The imports were minimum proportionate to the exports of the company in which of the following years?
Directions: The following line – graph gives the ratio of the amounts of imports by a company to the amount of exports from that company over the period from 2005 to 2011.

Q. If the imports of the company in 2006 be Rs. 272 crores, the exports from the company in the same year was:
Directions: The following line – graph gives the ratio of the amounts of imports by a company to the amount of exports from that company over the period from 2005 to 2011.

Q. If the imports in 2008 was Rs. 250 crores and the total exports in the years 2008 and 2009 together was Rs. 500 crores, then the imports in 2009 was-
Directions: Study the following line chart carefully and answer the questions given beside.
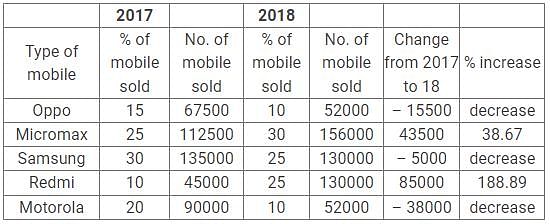
The percentage of 5 different types of mobile phones sold by a Store in 2017 and 2018.
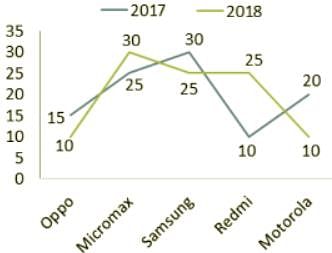
Total number of mobile phones sold in 2017 = 4,50,000
Total number of mobile phones sold in 2018 = 5,20,000
Q. If 15% of Motorola mobiles sold during 2017 and 2018 were returned by the customers due to some defects, then how many Motorola mobiles sold by the store were non-defective?


Directions: Study the following line chart carefully and answer the questions given beside.
The percentage of 5 different types of mobile phones sold by a Store in 2017 and 2018.

Total number of mobile phones sold in 2017 = 4,50,000
Total number of mobile phones sold in 2018 = 5,20,000
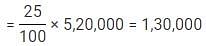
Q. If the percentage of Micromax mobiles sold in 2018 was the same as that of 2017, what would have been the number of Micromax mobiles sold in 2018?

Directions: Study the following line chart carefully and answer the questions given beside.
The percentage of 5 different types of mobile phones sold by a Store in 2017 and 2018.

Total number of mobile phones sold in 2017 = 4,50,000
Total number of mobile phones sold in 2018 = 5,20,000
Q. Find the ratio of the difference between the number of Samsung and Redmi mobiles sold in 2018 and 2017 respectively, and the number of Motorola mobiles sold in 2018.


Directions: Study the following line chart carefully and answer the questions given beside.
The percentage of 5 different types of mobile phones sold by a Store in 2017 and 2018.

Total number of mobile phones sold in 2017 = 4,50,000
Total number of mobile phones sold in 2018 = 5,20,000
Q. From 2017 to 2018, for which of the following mobile phones was the increase in percentage sale maximum?
Directions: Study the following line chart carefully and answer the questions given beside.
The percentage of 5 different types of mobile phones sold by a Store in 2017 and 2018.

Total number of mobile phones sold in 2017 = 4,50,000
Total number of mobile phones sold in 2018 = 5,20,000
Q. What was the difference in the total number of Samsung mobiles sold in 2017 and 2018?

Directions: Study the following line graph carefully and answer the questions given below:
Number of Students Appearing For Aptitude Test From Various Town (In Thousands)

Q. The number of students appearing for the Aptitude Test from Town D is approximately what percentage of the number of students appearing for the Aptitude Test from Town C?

Directions: Study the following line graph carefully and answer the questions given below:
Number of Students Appearing For Aptitude Test From Various Town (In Thousands)

Q. The number of students appearing for the Aptitude Test from Town E is approximately what percent of the total number of students appearing for the Aptitude Test from all the towns together?

Directions: Study the following line graph carefully and answer the questions given below:
Number of Students Appearing For Aptitude Test From Various Town (In Thousands)

Q. What is the average number of students appearing for the Aptitude Test from all the towns together?

Directions: Study the following line graph carefully and answer the questions given below:
Number of Students Appearing For Aptitude Test From Various Town (In Thousands)

Q. What is the ratio of the number of students appearing for the Aptitude Test from Town B to that from Town A?

Directions: Study the following line graph carefully and answer the questions given below:
Number of Students Appearing For Aptitude Test From Various Town (In Thousands)
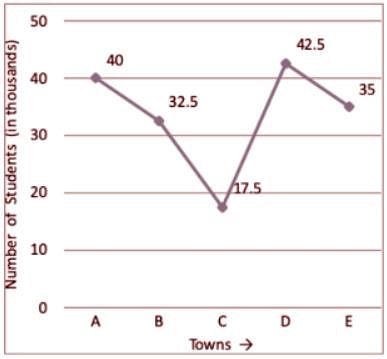
Q. What is the ratio of the number of students appearing for the Aptitude Test from Towns C and D together to the number of students appearing for the Aptitude Test from Towns A, D and E together?

Top Courses for Banking Exams


Important Questions for MCQ Test: Line Graph - 1
MCQ Test: Line Graph - 1
Online Tests for MCQ Test: Line Graph - 1
|
© EduRev
|
Education Revolution
|


|


