MCQ Test: Bar Graphs - 4 - Banking Exams MCQ
20 Questions MCQ Test - MCQ Test: Bar Graphs - 4
Directions: Study the following bar chart carefully and answer the questions given beside.
The following bar chart gives information about the number of Foreigners and Indians who visited five different places Goa, Shimla, Manali, Agra, and Pondicherry in India during the year 2017.

Q. The number of foreigner tourists visited in Goa during the year 2017 is approximately what percentage more than the number of foreigner tourists visited in Pondicherry during the year 2017?
The following bar chart gives information about the number of Foreigners and Indians who visited five different places Goa, Shimla, Manali, Agra, and Pondicherry in India during the year 2017.

Directions: Study the following bar chart carefully and answer the questions given beside.
The following bar chart gives information about the number of Foreigners and Indians who visited five different places Goa, Shimla, Manali, Agra, and Pondicherry in India during the year 2017.

Q. By what percentage the number of Indians who visited Shimla during the year 2017 is less than the number of Indians who visited Agra during the year 2017?
The following bar chart gives information about the number of Foreigners and Indians who visited five different places Goa, Shimla, Manali, Agra, and Pondicherry in India during the year 2017.

| 1 Crore+ students have signed up on EduRev. Have you? Download the App |
Directions: Study the following bar chart carefully and answer the questions given beside.
The following bar chart gives information about the number of Foreigners and Indians who visited five different places Goa, Shimla, Manali, Agra, and Pondicherry in India during the year 2017.

Q. The number of Foreigners who visited Agra during the year 2017 was approximately what percentage of the sum of the total number of Foreigners who visited the given five states during the year 2017?
The following bar chart gives information about the number of Foreigners and Indians who visited five different places Goa, Shimla, Manali, Agra, and Pondicherry in India during the year 2017.

Directions: Study the following bar chart carefully and answer the questions given beside.
The following bar chart gives information about the number of Foreigners and Indians who visited five different places Goa, Shimla, Manali, Agra, and Pondicherry in India during the year 2017.

Q. What is the difference between the number of foreigners who visited in the given five places during the year 2017 and the number of Indians who visited in the given five places during the year 2017?
Directions: Study the following bar chart carefully and answer the questions given beside.
The following bar chart gives information about the number of Foreigners and Indians who visited five different places Goa, Shimla, Manali, Agra, and Pondicherry in India during the year 2017.

Q. What percentage of total people who visited Goa during the year 2017 were Indians?
Directions: Study the following bar chart carefully and answer the questions given beside.
The following bar graph shows the amount of production and sales over the years.(in tons)

Q. What is the ratio of total production to total sales during the 6 given years?
Directions: Study the following bar chart carefully and answer the questions given beside.
The following bar graph shows the amount of production and sales over the years.(in tons)
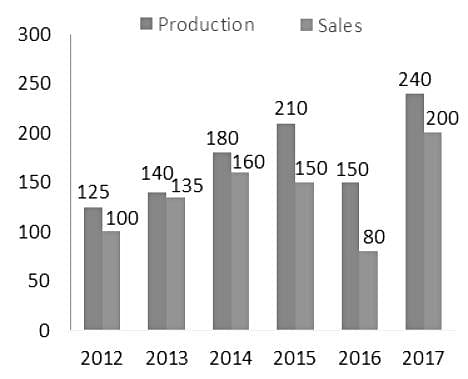
Q. In which of the following years the difference between production and sales was maximum?
Directions: Study the following bar chart carefully and answer the questions given beside.
The following bar graph shows the amount of production and sales over the years.(in tons)
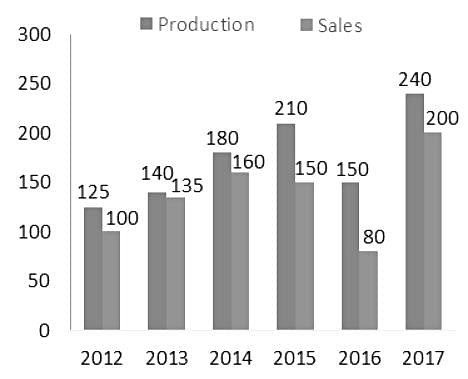
Q. If we combine production of all the given years together and the sales of all the given years together then what is the percentage of sales to production?
Directions: Study the following bar chart carefully and answer the questions given beside.
The following bar graph shows the amount of production and sales over the years.(in tons)

Q. In which of the following years, the percentage of sales to production was second highest?
Directions: Study the following bar chart carefully and answer the questions given beside.
The following bar graph shows the amount of production and sales over the years.(in tons)
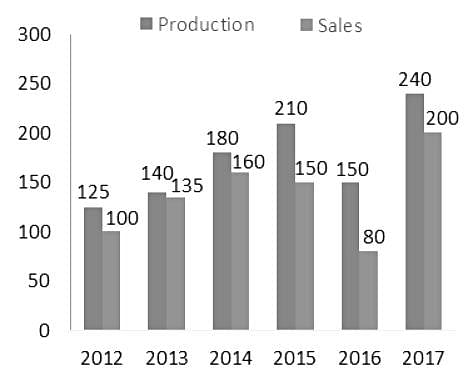
Q. What is the approximate percentage increase in production from 2016 to 2017?
Directions: Study the following bar chart carefully and answer the questions given beside.
A shopkeeper sells five different types of articles. The chart represents the profit percent earned and the discount given in five different articles.
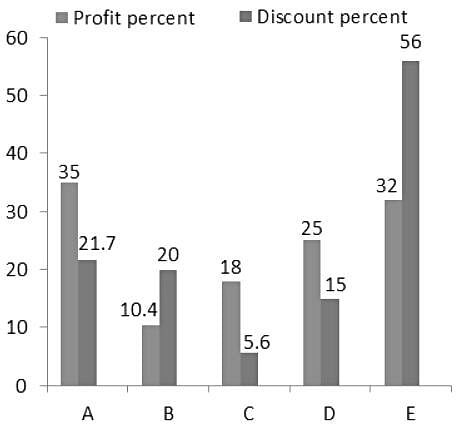
Q. If the cost price of article B and the article C are Rs. 2500 and Rs. 2400, respectively. Find the difference between the marked price of the article B and the marked price of the article C.
Directions: Study the following bar chart carefully and answer the questions given beside.
A shopkeeper sells five different types of articles. The chart represents the profit percent earned and the discount given in five different articles.
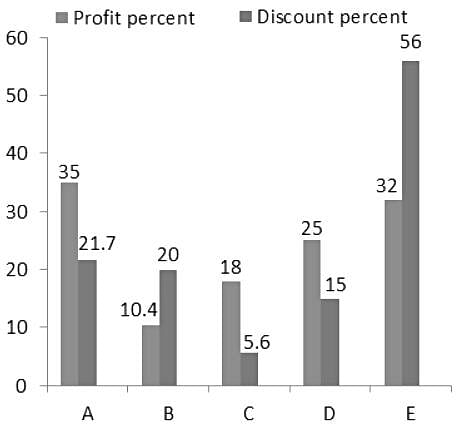
Q. If the selling price of the article A and the article D are Rs. 3132 and Rs. 1700, respectively then the marked price of the article D is what percent of the marked price of the article A?
Directions: Study the following bar chart carefully and answer the questions given beside.
A shopkeeper sells five different types of articles. The chart represents the profit percent earned and the discount given in five different articles.
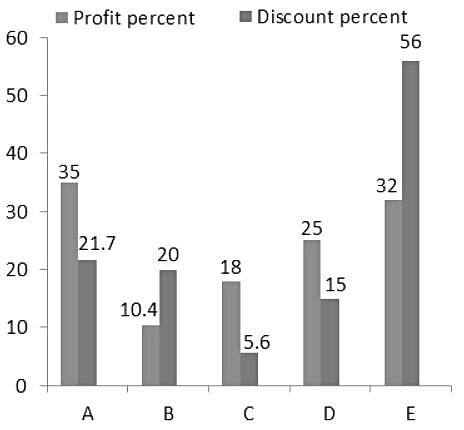
Q. What will be the ratio of the cost price of the article E and the cost price of the article C if the selling price of the article C and the selling price of the article E is Rs. 2124 and Rs. 1848, respectively?
Directions: Study the following bar chart carefully and answer the questions given beside.
A shopkeeper sells five different types of articles. The chart represents the profit percent earned and the discount given in five different articles.
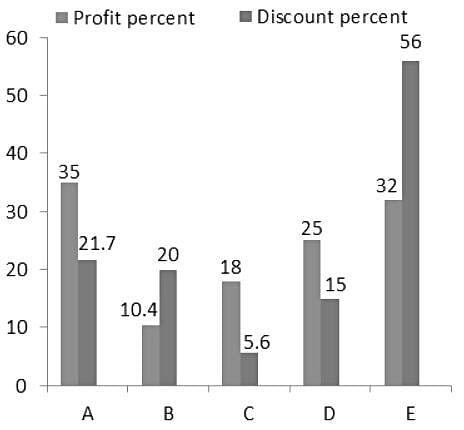
Q. If the marked price of the article E is Rs. 4800 then find the cost price of the article E.
Directions: Study the following bar chart carefully and answer the questions given beside.
A shopkeeper sells five different types of articles. The chart represents the profit percent earned and the discount given in five different articles.
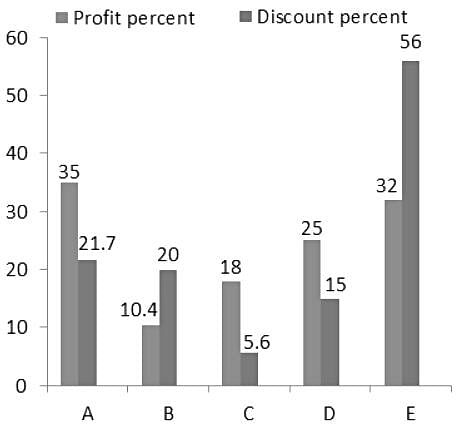
Q. The discount given in the article A has been reduced by 6.7% and also the marked price of the article has been reduced by Rs. 400. If initially, the cost price of article A is Rs. 2320, then find the difference between the discount given earlier and the discount given after reducing the marked price.
Direction: Study the following bar chart carefully and answer the questions given beside.
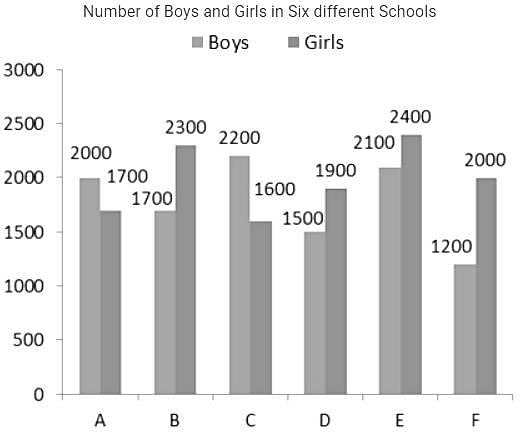
Q. Number of boys in school C is what percent of number of girls in school E?
Direction: Study the following bar chart carefully and answer the questions given beside.
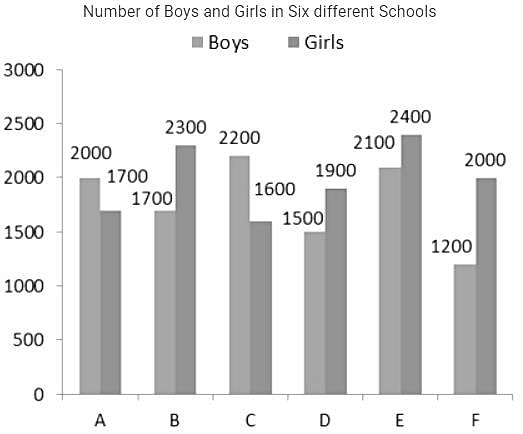
Q. Find the difference between total number of boys and total number of girls in all the schools.
Direction: Study the following bar chart carefully and answer the questions given beside.
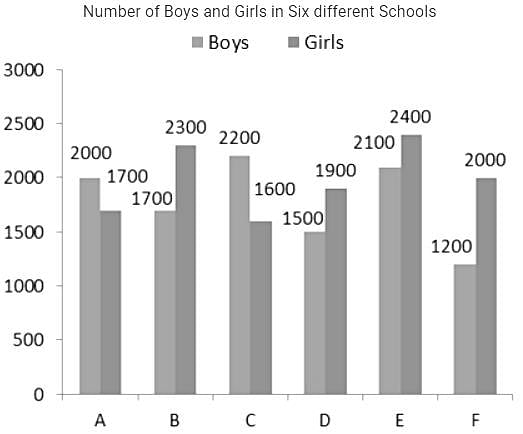
Q. Find the sum of total number of boys in schools A, B and C together and number of girls in schools D, E and F together.
Direction: Study the following bar chart carefully and answer the questions given beside.
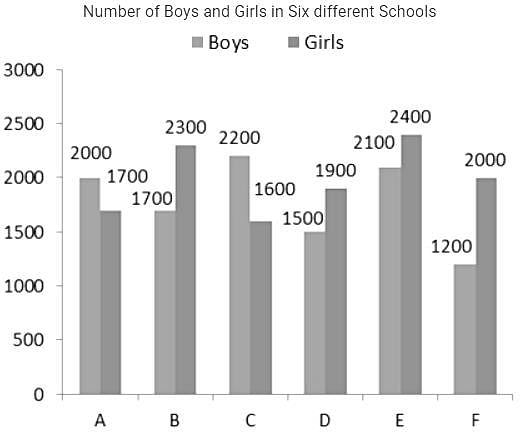
Q. Find the respective ratio of the number of students in school D and school F.
Direction: Study the following bar chart carefully and answer the questions given beside.
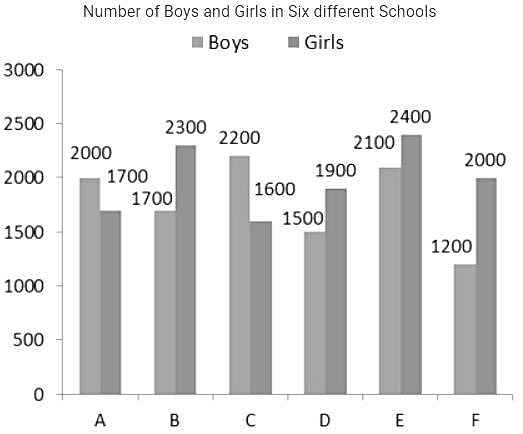
Q. Number of girls in school F is what percent more than the number of girls in school C?


 = 30.95% = approximately 31%

 approximately


