MCQ Test: Pie Chart - 1 - Banking Exams MCQ
20 Questions MCQ Test - MCQ Test: Pie Chart - 1

Various expenditures incurred by a publishing company for publishing a book in 2018 are given in the following pie chart. Study the chart and answer the question.

Q. Price printed on a book is 15% above the cost price. If the price printed on a book is Rs. 942, then the cost of paper for a single copy in Rs. is (rounded off to one decimal place)
The given pie charts represent the distribution of candidates who enrolled for a bank clerical examination and the candidates (out of those enrolled) who passed the examination, from five different institutes P, Q, R, S and T. Study the pie charts and answer the question that follows.
i. Total number of candidates who enrolled for the examination from five institutes = 5500

ii. Total number of candidates who passed the examination from five institutes = 3300
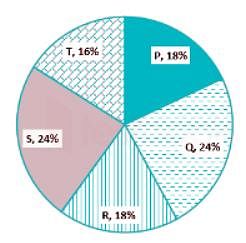
Q. The average number of candidates passed from institutes P and Q together is what percentage of the total number of candidates enrolled from institutes P and Q together?
ii. Total number of candidates who passed the examination from five institutes = 3300
| 1 Crore+ students have signed up on EduRev. Have you? Download the App |
Direction: The following pie-chart shows the monthly expenditure of a family on various items. If the family spends Rs. 825 on clothing answer the questions.

Q. What is the ratio of expenses on food and miscellaneous?
Direction: The following pie-chart shows the monthly expenditure of a family on various items. If the family spends Rs. 825 on clothing answer the questions.
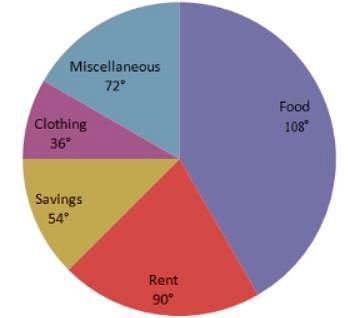
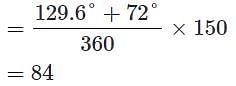
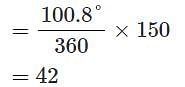
Q. The ratio of average of expenses on food, clothing and miscellaneous items to the average of expenses of on saving and rent is:

Direction: The following pie-chart shows the monthly expenditure of a family on various items. If the family spends Rs. 825 on clothing answer the questions.

Q. What is the total monthly income of the family?
Direction: The following pie-chart shows the monthly expenditure of a family on various items. If the family spends Rs. 825 on clothing answer the questions.

Q. What percent of the total income does the family save.

Direction: The following pie-chart shows the monthly expenditure of a family on various items. If the family spends Rs. 825 on clothing answer the questions.

Q. What is the average of expenses of clothing and rent.

Directions: This is a pie chart for the data on A, B, O, AB blood groups of 150 donors. Observe the pie chart and answer the questions.

Q. The ratio of donors blood group ‘A’ to the average of the donors group ‘O’, ‘B’ and ‘AB’ is:

Directions: This is a pie chart for the data on A, B, O, AB blood groups of 150 donors. Observe the pie chart and answer the questions.

Q. What is the percentage of donors having blood group ‘AB’?

Directions: This is a pie chart for the data on A, B, O, AB blood groups of 150 donors. Observe the pie chart and answer the questions.

Q. The number of persons having either blood group ‘A’ or blood group ‘B’ is:
Directions: This is a pie chart for the data on A, B, O, AB blood groups of 150 donors. Observe the pie chart and answer the questions.

Q. The number of donors having group ‘O’ is:
Directions: The following pie- chart shows the study- time of different subject of a student in a day. Study the pie chart and answer the following questions.

Q. Instead of 10%, if the students spends 15% to study other subjects and the time is taken from the time scheduled to study mathematics and if he/she used to study 20 hours per day, then their difference of time for study mathematics per day is:
Directions: The following pie- chart shows the study- time of different subject of a student in a day. Study the pie chart and answer the following questions.

Q. The time spent to study history and chemistry is 4 hours 30 minutes, Then the student studies physics for:

Directions: The following pie- chart shows the study- time of different subject of a student in a day. Study the pie chart and answer the following questions.

Q. If then student studies chemistry for 3 hours, then he/she studies geography for:

Directions: The following pie- chart shows the study- time of different subject of a student in a day. Study the pie chart and answer the following questions.
Q. If the student studies 10 hours in a day, then he/she studies mathematic for:
Direction: Study the pie- chart carefully and answer the questions. The pie- chart represents the percentage of people involved in various occupations.
Total number of people = 20000.

Q. The difference between the maximum number of people involved and minimum number of people involved in various professions is:
Direction: Study the pie- chart carefully and answer the questions. The pie- chart represents the percentage of people involved in various occupations.
Total number of people = 20000.
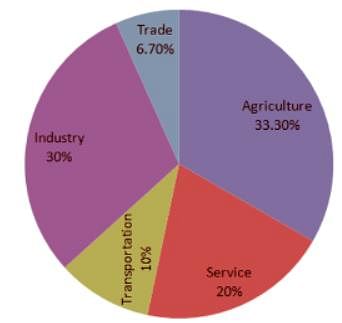
Q. The ratio of the people involved in service to that of industry is-

Direction: Study the pie- chart carefully and answer the questions. The pie- chart represents the percentage of people involved in various occupations.
Total number of people = 20000.

Q. How many more people are involved in service than in trade?
Direction: Study the pie- chart carefully and answer the questions. The pie- chart represents the percentage of people involved in various occupations.
Total number of people = 20000.

Q. The sectorial angle made by the people involved in service in the given pie- chart is:

Study the pie chart that shows the quantity wise sales distribution of five products (A, B, C, D and E) of a company in 2019 and answer the question that follows.
Quantity wise sales distribution of five products (A. B. C. D and E)

Q. If 2100 units of product C were sold in 2019 and the total number of units sold by the company in 2020 was 28% more than that in 2019, then how many units were sold by the company in 2020?
Top Courses for Banking Exams


Important Questions for MCQ Test: Pie Chart - 1
MCQ Test: Pie Chart - 1
Online Tests for MCQ Test: Pie Chart - 1
|
© EduRev
|
Education Revolution
|


|


