MCQ Test: Pie Chart - 2 - Banking Exams MCQ
20 Questions MCQ Test - MCQ Test: Pie Chart - 2

Directions: In the given pie- chart, the comparative study of the production of rice, wheat, sugar and tea of a country is given. Study the pie- chart and answer the following questions.
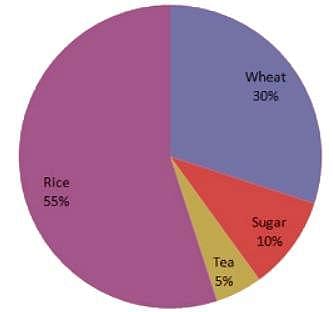
Q. From this diagram the ratio of sum of wheat and sugar production to difference in production of rice and tea is:
Directions: In the given pie- chart, the comparative study of the production of rice, wheat, sugar and tea of a country is given. Study the pie- chart and answer the following questions.

Q. The central angle of wheat % is:
| 1 Crore+ students have signed up on EduRev. Have you? Download the App |
Directions: In the given pie- chart, the comparative study of the production of rice, wheat, sugar and tea of a country is given. Study the pie- chart and answer the following questions.

Q. The production of rice and tea is more/ greater than production of wheat by-

Directions: In the given pie- chart, the comparative study of the production of rice, wheat, sugar and tea of a country is given. Study the pie- chart and answer the following questions.

Q. The production of Rice, Wheat, Sugar and Tea is 500000 kg. Find the production of Rice.

The pie chart given below shows the number of truck sold by 8 different companies. The total number of truck sold by all these 8 companies are 4000. Number of truck sold by a particular company is shown as a percent of total number of truck sold by all these 8 companies.
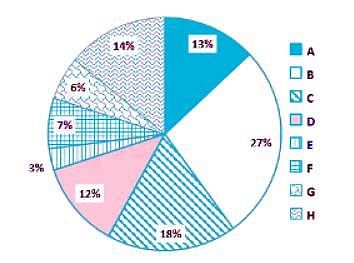
Q. The number of trucks sold by B, C, F and H is how much percent less than the number of trucks sold by all these 8 companies?
Directions: Revenue earned by the Central Government is given in pie-chart. Study the pie-chart and answer the following questions:

Q. If the income of Central Government from Excise duty is 28,618 crores, then the total revenue earned by the Government is:

Directions: Revenue earned by the Central Government is given in pie-chart. Study the pie-chart and answer the following questions:

Q. The ratio of revenue of the Central Government earned from the Custom Duty and income tax is-
Directions: Revenue earned by the Central Government is given in pie-chart. Study the pie-chart and answer the following questions:
Q. The ratio of revenue earned from excise duty and custom duty to that of other is:
Directions: Revenue earned by the Central Government is given in pie-chart. Study the pie-chart and answer the following questions:
Q. If the percentage of revenue earned by the Central Government from Corporation Tax is X times to that of the percentage of money earned from percentage of money earned from Excise Duty, then the value of x is.
Directions: Study the following pie chart carefully and answer the questions.
The pie chart given below shows the percentage distribution of the total number of male faculties in six different schools.
Total male faculties in all schools together = 8400

Q. If the total number of faculties in school F is 1820. Then female faculties in school F are what percentage more/less than total male faculties in school B?
Directions: The following pie-chart shows the sources of funds to be collected by the National Highways Authority of India (NHAI) for its phase II projects. Study the pie-chart and answer the following three questions:

Q. If NHAI could receive a total of Rs. 9,695 crores as External Assistance, by what percent (approximately) should it increase the market Borrowing to arrange for the shortage of funds?

Directions: The following pie-chart shows the sources of funds to be collected by the National Highways Authority of India (NHAI) for its phase II projects. Study the pie-chart and answer the following three questions:
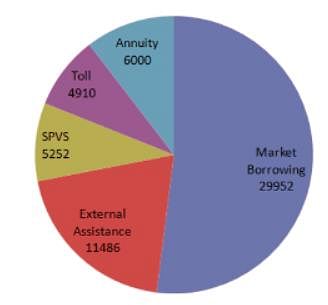
Q. The central angle corresponding to Market Borrowings is:

Directions: The following pie-chart shows the sources of funds to be collected by the National Highways Authority of India (NHAI) for its phase II projects. Study the pie-chart and answer the following three questions:

Q. If the toll is to be collected through and outsourced agency by allowing a maximum 10% commission how much amount should be permitted to be collected by the outsourced agency, so that the project is supported with Rs. 4,910 crores?

Directions: Study the pie-chart and table given below and answer the questions.
Details of the percentage of employees working in various departments in an organization and number of males among them.
Total number of employees = 800.


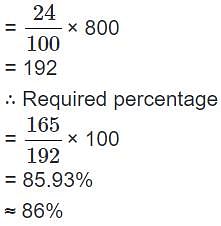
Q. The percentage of the number of male employees working in marketing department to the total number of employees in marketing department is:
Directions: Study the pie-chart and table given below and answer the questions.
Details of the percentage of employees working in various departments in an organization and number of males among them.
Total number of employees = 800.
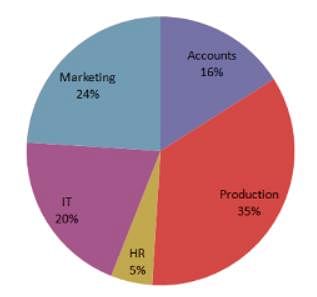

Q. The ratio of number of males in marketing department to the number of females working in that department is:
Directions: Study the pie-chart and table given below and answer the questions.
Details of the percentage of employees working in various departments in an organization and number of males among them.
Total number of employees = 800.

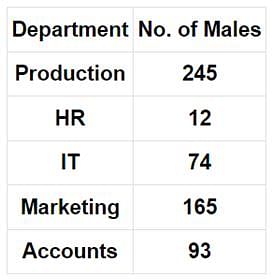
Q. The respective ratio between the number of females working in HR department to the total number of employees working in the HR department is:

Directions: Study the pie-chart and table given below and answer the questions.
Details of the percentage of employees working in various departments in an organization and number of males among them.
Total number of employees = 800.


Q. The percentage of females working in IT department to the total number of employees working in the organization is:


Directions: Pie-charts show the expenses on various heads show the expenses on various heads in construction of a house. Study the pie-chart.


Q. The percentage increase in the amount spent on labour from 1991 to 2001, given that the total amount spent on the construction of the house is Rs. 360000 in 1991 and Rs. 864000 in 2001 is:

Directions: Pie-charts show the expenses on various heads show the expenses on various heads in construction of a house. Study the pie-chart.
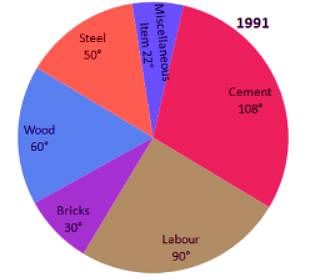

Q. What percentage of the total amount is being spent on cement in 1991?

Directions: Pie-charts show the expenses on various heads show the expenses on various heads in construction of a house. Study the pie-chart.


Q. If the total cost of constructing the house is Rs. 3,60,000 in 1991 and Rs. 8,64,000 in 2001, what is the amount spent on Steel in 1991 and 2001?

Top Courses for Banking Exams


Important Questions for MCQ Test: Pie Chart - 2
MCQ Test: Pie Chart - 2
Online Tests for MCQ Test: Pie Chart - 2
|
© EduRev
|
Education Revolution
|


|


