MCQ Test: Pie Chart - 3 - Banking Exams MCQ
20 Questions MCQ Test - MCQ Test: Pie Chart - 3
Directions: In the following question, study the two pie-charts and answer the questions.
April Month's Salary = Rs. 24000.

May Month's Salary = Rs. 25000.

Q. The ratio of amount spent for saving in April month’s salary and miscellaneous in May month’s salary is-
April Month's Salary = Rs. 24000.

May Month's Salary = Rs. 25000.

Directions: In the following question, study the two pie-charts and answer the questions.
April Month's Salary = Rs. 24000.

May Month's Salary = Rs. 25000.

Q. What is the percent increase in Education in May month than April month?
April Month's Salary = Rs. 24000.

May Month's Salary = Rs. 25000.

| 1 Crore+ students have signed up on EduRev. Have you? Download the App |
Directions: In the following question, study the two pie-charts and answer the questions.
April Month's Salary = Rs. 24000.

May Month's Salary = Rs. 25000.
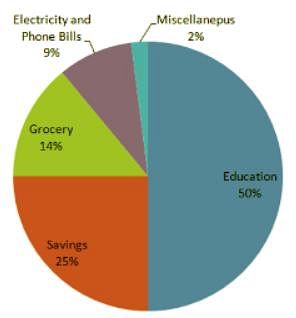
Q. From the salary of May, the amount spent on Grocery and Electricity are:
April Month's Salary = Rs. 24000.

May Month's Salary = Rs. 25000.

Directions: Study the following pie-chart carefully and answer the questions that follow:
Degreewise Break-up of Expenditure of a Family in a month
Total Amount Spent In a Month = Rs. 45800.

Q.What is the ratio of the amount spent by the family on medicine to the amount spent on groceries?
Directions: Study the following pie-chart carefully and answer the questions that follow:
Degreewise Break-up of Expenditure of a Family in a month
Total Amount Spent In a Month = Rs. 45800.

Q. The total amount spent by the family on Groceries, Entertainment and Investment together forms approximately what percent of the amount spent on Commuting?
Directions: Study the following pie-chart carefully and answer the questions that follow:
Degreewise Break-up of Expenditure of a Family in a month
Total Amount Spent In a Month = Rs. 45800.

Q. What is the amount spent by the family on commuting?
Directions: Study the following pie-chart carefully and answer the questions that follow:
Degreewise Break-up of Expenditure of a Family in a month
Total Amount Spent In a Month = Rs. 45800.

Q. What is the total amount spent by the family on Entertainment and Shopping together?
Direction: Study the pie-chart given below carefully and answer the questions that follow.
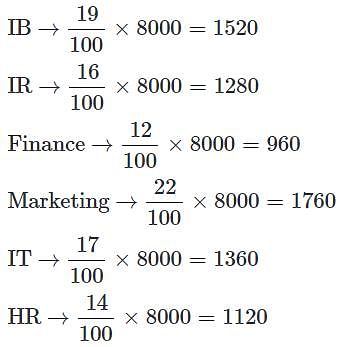
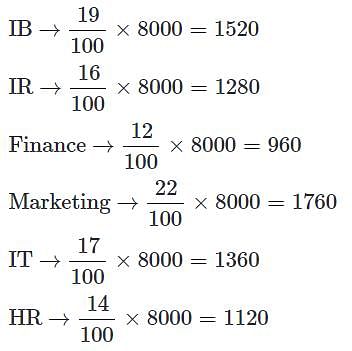
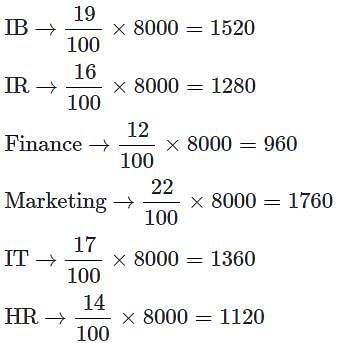
Percentage-wise break up of students in terms of specialization in M.B.A.
Total Number of students = 8000.

Q. What is the ratio of the students having finance as specialisation to students having HR as specialisation?
Direction: Study the pie-chart given below carefully and answer the questions that follow.
Percentage-wise break up of students in terms of specialization in M.B.A.
Total Number of students = 8000.

Q. What is the total number of students having specialisation in IR, marketing and IT?
Direction: Study the pie-chart given below carefully and answer the questions that follow.
Percentage-wise break up of students in terms of specialization in M.B.A.
Total Number of students = 8000.

Q. What is the total number of students having IB as specialisation?
Direction: Study the pie-chart given below carefully and answer the questions that follow.
Percentage-wise break up of students in terms of specialization in M.B.A.
Total Number of students = 8000.

Q. Students having IR as specialisation forms approximately what percent of students having HR as specialisation?
Direction: Study the pie-chart given below carefully and answer the questions that follow.
Percentage-wise break up of students in terms of specialization in M.B.A.
Total Number of students = 8000.
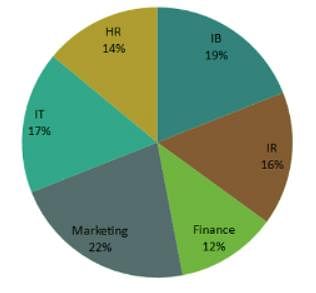
Q. Students having IB as specialisation forms approximately what percent of students having Marketing as specialisation?
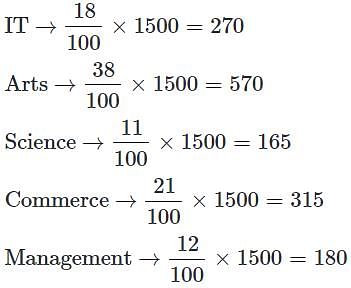
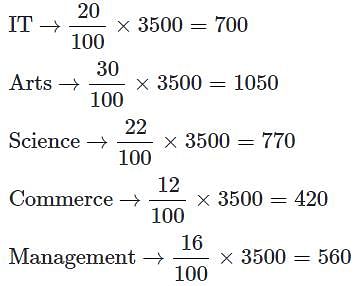
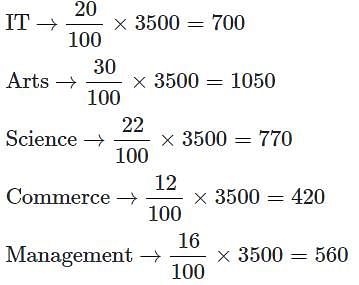
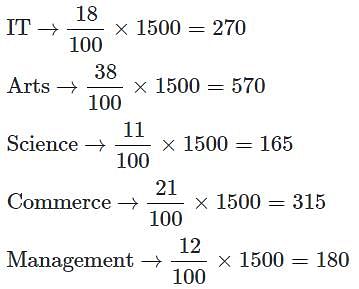
Directions: Study the following pie-charts carefully and answer the questions that follow:
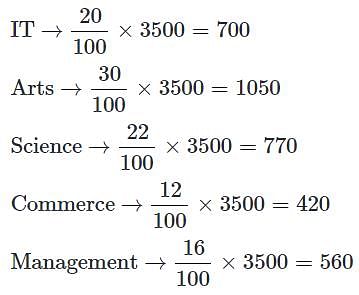
Percentage of Students Enrolled in Different Streams in a College.
Total Number of Students = 3500.

Percentage Break-up of Girls Enrolled in These Streams Out of The Total Students.
Total Number of Girls = 1500.
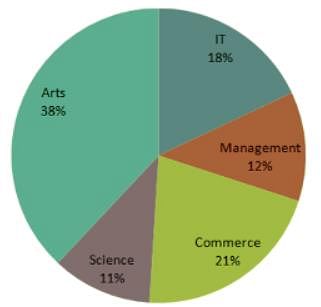
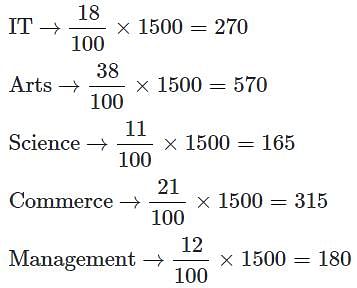
Q. If 20% of the girls enrolled in science change their stream to Management, then what will be the new number of Management students altogether?
Directions: Study the following pie-charts carefully and answer the questions that follow:
Percentage of Students Enrolled in Different Streams in a College.
Total Number of Students = 3500.

Percentage Break-up of Girls Enrolled in These Streams Out of The Total Students.
Total Number of Girls = 1500.

Q. What is the total number of boys enrolled in Management and IT together?
Directions: Study the following pie-charts carefully and answer the questions that follow:
Percentage of Students Enrolled in Different Streams in a College.
Total Number of Students = 3500.

Percentage Break-up of Girls Enrolled in These Streams Out of The Total Students.
Total Number of Girls = 1500.

Q. What is the total number of girls enrolled in Science and Commerce together?
Directions: Study the following pie-charts carefully and answer the questions that follow:
Percentage of Students Enrolled in Different Streams in a College.
Total Number of Students = 3500.

Percentage Break-up of Girls Enrolled in These Streams Out of The Total Students.
Total Number of Girls = 1500.

Q. The number of girls enrolled in Arts, Science and Commerce forms what percent of total number of students in the college?
Directions: Study the following pie-charts carefully and answer the questions that follow:
Percentage of Students Enrolled in Different Streams in a College.
Total Number of Students = 3500.

Percentage Break-up of Girls Enrolled in These Streams Out of The Total Students.
Total Number of Girls = 1500.

Q. What is the ratio of the number of girls enrolled in Arts to the number of boys enrolled in Science?
Directions: Study the following pie-chart and table carefully and answer the questions given below:
Percentage-wise Distribution of the Number of Mobile phones Sold by a Shopkeeper During Six Months. Ratio of mobile phones sold of Company A & Company B.


Q. What is the total number of mobile phones Sold of company B during August and September together?
Directions: Study the following pie-chart and table carefully and answer the questions given below:
Percentage-wise Distribution of the Number of Mobile phones Sold by a Shopkeeper During Six Months. Ratio of mobile phones sold of Company A & Company B.
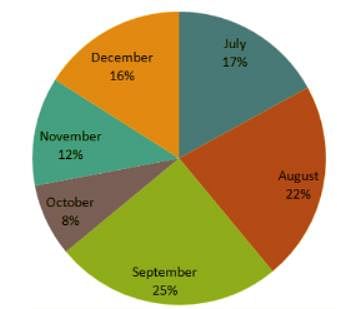

Q. If 35% of the mobile phones sold by company A during November were sold at a discount, how many mobile phones of company A were sold without a discount, during that month?
Directions: Study the following pie-chart and table carefully and answer the questions given below:
Percentage-wise Distribution of the Number of Mobile phones Sold by a Shopkeeper During Six Months. Ratio of mobile phones sold of Company A & Company B.


Q. The number of mobile phones sold of Company A during July is approximately what percent of the number of mobile phones sold of company A during December?


