Class 10 Exam  >  Class 10 Tests  >  Test: Relation between Central Tendencies - Class 10 MCQ

Test: Relation between Central Tendencies - Class 10 MCQ


Test Description

10 Questions MCQ Test - Test: Relation between Central Tendencies

Test: Relation between Central Tendencies for Class 10 2024 is part of Class 10 preparation. The Test: Relation between Central Tendencies questions and answers have been prepared according to the Class 10 exam syllabus.The Test: Relation between Central Tendencies MCQs are made for Class 10 2024 Exam. Find important definitions, questions, notes, meanings, examples, exercises, MCQs and online tests for Test: Relation between Central Tendencies below.
Solutions of Test: Relation between Central Tendencies questions in English are available as part of our course for Class 10 & Test: Relation between Central Tendencies solutions in Hindi for Class 10 course. Download more important topics, notes, lectures and mock test series for Class 10 Exam by signing up for free. Attempt Test: Relation between Central Tendencies | 10 questions in 10 minutes | Mock test for Class 10 preparation | Free important questions MCQ to study for Class 10 Exam | Download free PDF with solutions
Test: Relation between Central Tendencies - Question 1

The mean and median of same data are 24 and 26 respectively. The value of mode is :

Test: Relation between Central Tendencies - Question 2

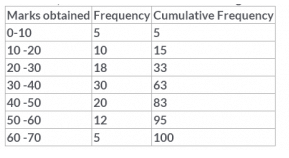
The mode, median and mean of the following data are:​

Detailed Solution for Test: Relation between Central Tendencies - Question 2

Median = L + [ (N/2 – F) / f ]C
=30+[(50-33)/30]*10
=35.66
Mode=L+
=30+ 
=35.45
Mean=(3Median-Mode)/2
 =(106.98-35.45)/2=35.76

1 Crore+ students have signed up on EduRev. Have you? Download the App
Test: Relation between Central Tendencies - Question 3

If median of 20 observations is 50 and mode is also 50, then the mean is

Test: Relation between Central Tendencies - Question 4

For a symmetrical distribution, which is correct

Detailed Solution for Test: Relation between Central Tendencies - Question 4

A distribution is symmetrical if a vertical line can be drawn at some point in the histogram such that the shape to the left and the right of the vertical line are mirror images of each other. The mean, the median, and the mode are each equal for these type of data. In a perfectly symmetrical distribution, the mean and the median are the same. In a symmetrical distribution that has two modes (bimodal), the two modes would be different from the mean and median.

Test: Relation between Central Tendencies - Question 5

The median of the given data is 46 and the total number of items is 230.

Using the formula Mode = 3 Median – 2 Mean, the mean will be

Detailed Solution for Test: Relation between Central Tendencies - Question 5

To find Mode
Mode=L+ 
Where L=lower limit of the modal class  = 40
f1 = modal class frequency.= 65
f2 = just after the modal class frequency.=46 
f0 = just previous the modal class frequency=34
C = Class size=10
Mode = 
=46.2
Mode = 3 Median – 2 Mean
46.2 =3*46-2Mean
2Mean=138-46.2=91.8
Mean=91.8/2=45.9

Test: Relation between Central Tendencies - Question 6

For the following frequency distribution:

If the mode and the median are 12.9 and 14.44 respectively, then the mean is​

Test: Relation between Central Tendencies - Question 7

A student noted the number of cars passing through a spot on a road for 100 periods each of 3 minutes and summarized it in the table given below

The mode, median and mean of the data is​

Test: Relation between Central Tendencies - Question 8

If the median of the following data is 166.79, then the mean and mode are

Detailed Solution for Test: Relation between Central Tendencies - Question 8

We have
Mode=L+ 
Where L=lower limit of the modal class =160
f1= modal class frequency.=28
f2 = just after the modal class frequency.=24
f0 = just previous the modal class frequency=17
C = Class size=10
Mode= 
=167.3
Mode = 3 Median – 2 Mean
Mean=(3*166.79-167.3)/2=168.03

Test: Relation between Central Tendencies - Question 9

The mean and the median of a distribution are 45.9 and 46 respectively. The mode will be

Test: Relation between Central Tendencies - Question 10

Which of the following is not a measure of central tendency?

Detailed Solution for Test: Relation between Central Tendencies - Question 10

A measure of central tendency is a measure that represents the center point or typical value of a data. These measures indicate where most values in a distribution fall and are also referred to as the central location of a distribution.It can also be viewed as the tendency of data to cluster around a middle value.Standard deviation as the name suggests is a measure of the deviation. Deviation means change or distance. But change is always followed by the word 'from'. Hence standard deviation is a measure of change or the distance from a measure of central tendency  which is normally the mean. Hence, standard deviation is different from a measure of central tendency.

Information about Test: Relation between Central Tendencies Page
In this test you can find the Exam questions for Test: Relation between Central Tendencies solved & explained in the simplest way possible. Besides giving Questions and answers for Test: Relation between Central Tendencies, EduRev gives you an ample number of Online tests for practice

Top Courses for Class 10

Download as PDF

Top Courses for Class 10