MCQ: Pie Charts - 1 - SSC CGL MCQ
15 Questions MCQ Test - MCQ: Pie Charts - 1
Direction: The following pie-chart shows the sources of funds to be collected by the National Highways Authority of India (NHAI) for its Phase II projects. Study the pie-chart and answers the question that follow.
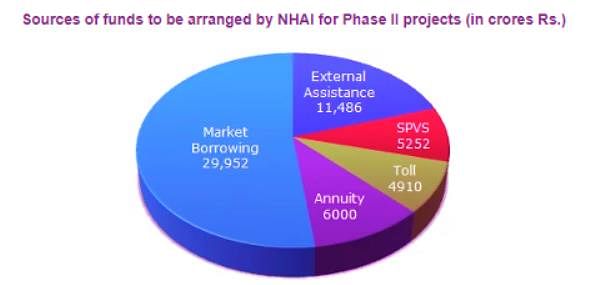
Q. If NHAI could receive a total of Rs. 9695 crores as External Assistance, by what percent (approximately) should it increase the Market Borrowing to arrange for the shortage of funds?

Direction: The following pie-chart shows the sources of funds to be collected by the National Highways Authority of India (NHAI) for its Phase II projects. Study the pie-chart and answers the question that follow.
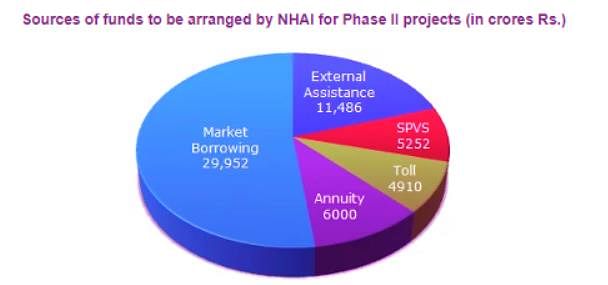
Q. The approximate ratio of the funds to be arranged through Toll and that through Market Borrowing is:

| 1 Crore+ students have signed up on EduRev. Have you? Download the App |
Direction: The following pie-chart shows the sources of funds to be collected by the National Highways Authority of India (NHAI) for its Phase II projects. Study the pie-chart and answers the question that follow.
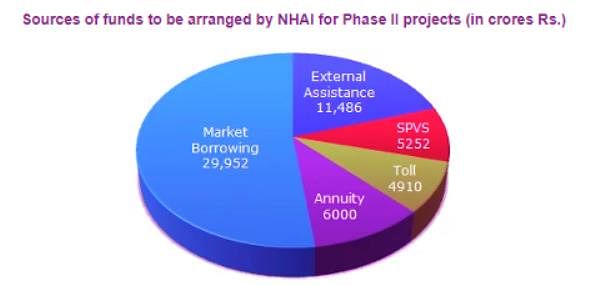
Q. If the toll is to be collected through an outsourced agency by allowing a maximum 10% commission, how much amount should be permitted to be collected by the outsourced agency, so that the project is supported with Rs. 4910 crores?

Direction: The following pie-chart shows the sources of funds to be collected by the National Highways Authority of India (NHAI) for its Phase II projects. Study the pie-chart and answers the question that follow.
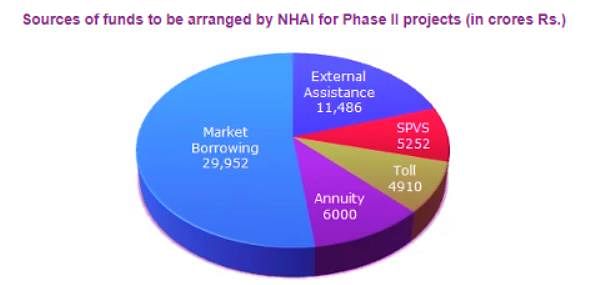
Q. Near about 20% of the funds are to be arranged through:
Direction: The following pie-chart shows the sources of funds to be collected by the National Highways Authority of India (NHAI) for its Phase II projects. Study the pie-chart and answers the question that follow.
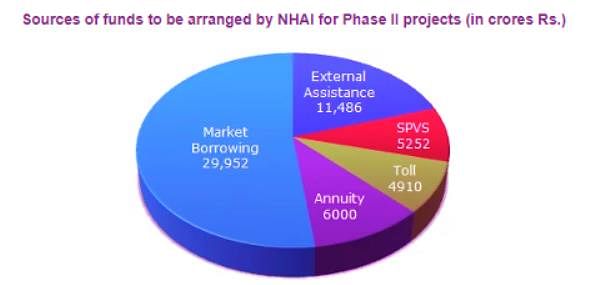
Q. The central angle corresponding to Market Borrowing is:
Direction: The following pie-charts show the distribution of students of graduate and post-graduate levels in seven different institutes - M, N, P, Q, R, S and T in a town.
Distribution of students at graduate and post-graduate levels in seven institutes- M, N, P, Q, R, S, and T
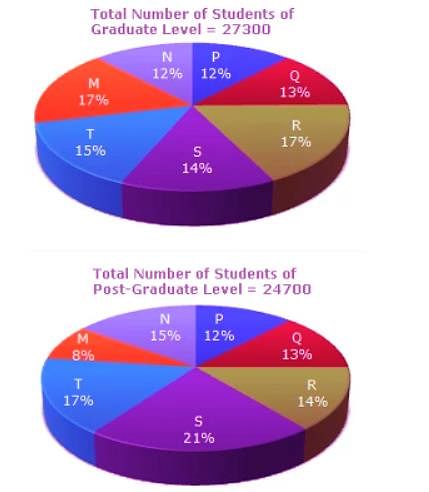
Q. What is the ratio between the number of students studying at post-graduate and graduate levels respectively from institute S?
Direction: The following pie-charts show the distribution of students of graduate and post-graduate levels in seven different institutes - M, N, P, Q, R, S and T in a town.
Distribution of students at graduate and post-graduate levels in seven institutes- M, N, P, Q, R, S, and T
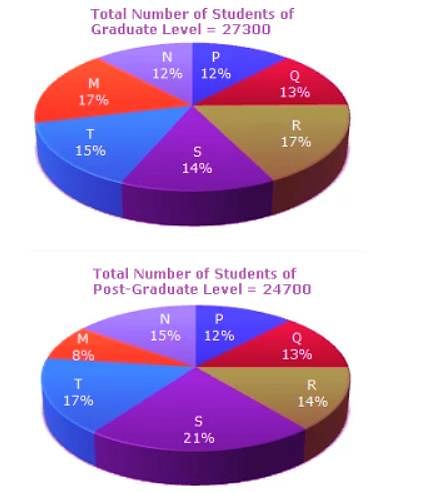
Q. What is the ratio between the number of students studying at post-graduate level from institutes S and the number of students studying at graduate level from institute Q?
Direction: The following pie-charts show the distribution of students of graduate and post-graduate levels in seven different institutes - M, N, P, Q, R, S and T in a town.
Distribution of students at graduate and post-graduate levels in seven institutes- M, N, P, Q, R, S, and T
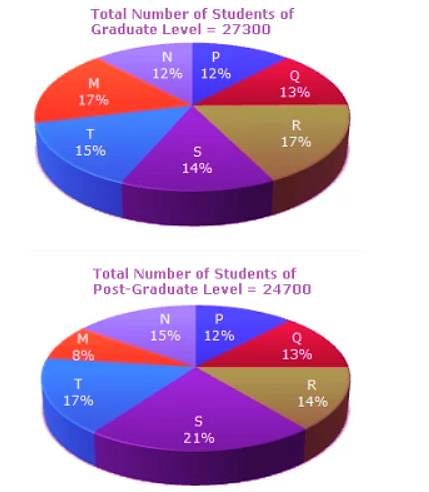
Q. Total number of students studying at post-graduate level from institutes N and P is:
Direction: The following pie-charts show the distribution of students of graduate and post-graduate levels in seven different institutes - M, N, P, Q, R, S and T in a town.
Distribution of students at graduate and post-graduate levels in seven institutes- M, N, P, Q, R, S, and T
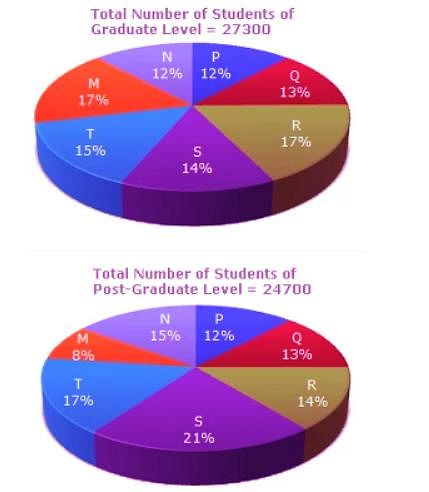
Q. What is the total number of graduate and post-graduate level students in institute R?
Direction: The following pie-charts show the distribution of students of graduate and post-graduate levels in seven different institutes - M, N, P, Q, R, S and T in a town.
Distribution of students at graduate and post-graduate levels in seven institutes- M, N, P, Q, R, S, and T
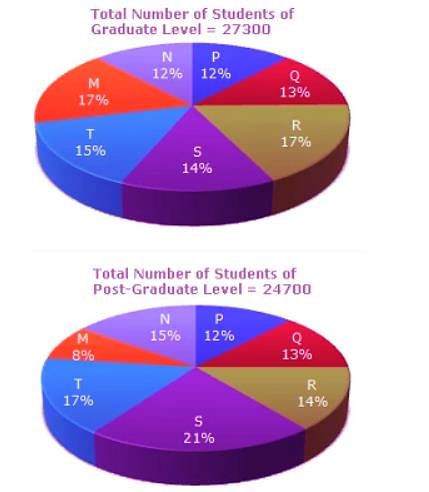
Q. How many students of institutes M and S are studying at graduate level?
Direction: The following pie-chart shows the percentage distribution of the expenditure incurred in publishing a book. Study the pie-chart and answer the questions based on it.
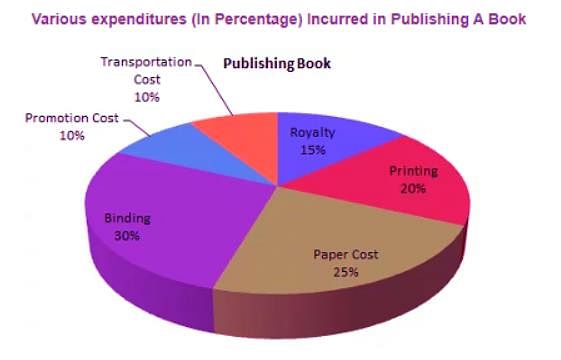
Q. If 5500 copies are published and the transportation cost on them amounts to Rs. 82,500, then what should be the selling price of the book so that the publisher can earn a profit of 25% ?
Direction: The following pie-chart shows the percentage distribution of the expenditure incurred in publishing a book. Study the pie-chart and answer the questions based on it.
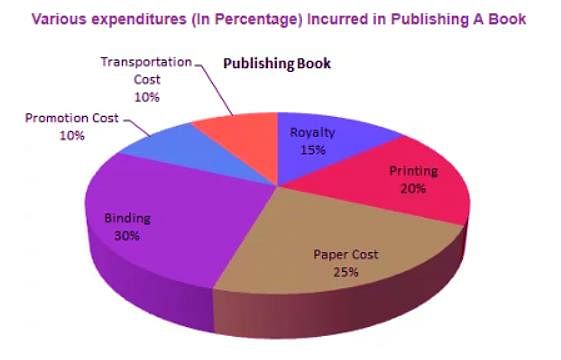
Q. For an edition of 12,500 copies, the amount of Royalty paid by the publisher is Rs. 2,81,250. What should be the selling price of the book if the publisher desires a profit of 5%?
Direction: The following pie-chart shows the percentage distribution of the expenditure incurred in publishing a book. Study the pie-chart and answer the questions based on it.
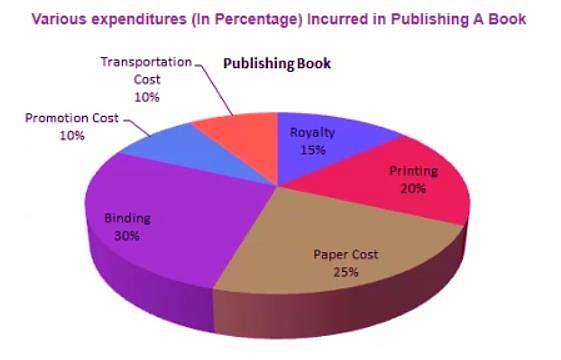
Q. If for an edition of the book, the cost of paper is Rs. 56250, then find the promotion cost for this edition.
Direction: The following pie-chart shows the percentage distribution of the expenditure incurred in publishing a book. Study the pie-chart and answer the questions based on it.
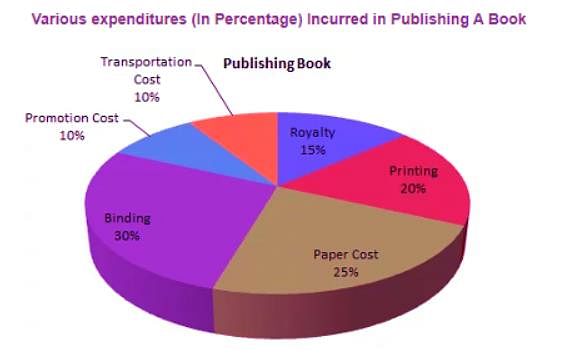
Q. The price of the book is marked 20% above the C.P. If the marked price of the book is Rs. 180, then what is the cost of the paper used in a single copy of the book?
Direction: The following pie-chart shows the percentage distribution of the expenditure incurred in publishing a book. Study the pie-chart and answer the questions based on it.
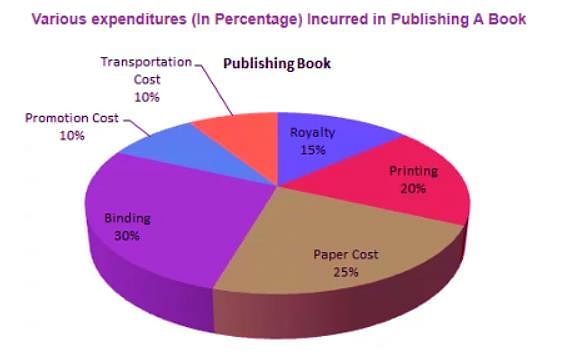
Q. If for a certain quantity of books, the publisher has to pay Rs. 30,600 as printing cost, then what will be the amount of royalty to be paid for these books?


