SSC CGL Exam  >  SSC CGL Test  >  Quantitative Aptitude  >  MCQ: Measures of Central Tendency and Variation - SSC CGL MCQ

Measures of Central Tendency and Variation - Free MCQ Practice Test


MCQ Practice Test & Solutions: MCQ: Measures of Central Tendency and Variation (15 Questions)

You can prepare effectively for SSC CGL Quantitative Aptitude for SSC CGL with this dedicated MCQ Practice Test (available with solutions) on the important topic of "MCQ: Measures of Central Tendency and Variation". These 15 questions have been designed by the experts with the latest curriculum of SSC CGL 2026, to help you master the concept.

Test Highlights:

  • - Format: Multiple Choice Questions (MCQ)
  • - Duration: 15 minutes
  • - Number of Questions: 15

Sign up on EduRev for free to attempt this test and track your preparation progress.

MCQ: Measures of Central Tendency and Variation - Question 1

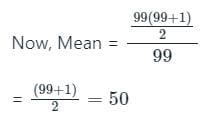
What is the mean of first 99 natural numbers?

Detailed Solution: Question 1

Concept:

Suppose there are ‘n’ observations {x1, x2, x3,…, xn}

Sum of the first n natural numbers 

Calculation:

To find: Mean of the first 99 natural numbers

As we know, Sum of first n natural numbers

MCQ: Measures of Central Tendency and Variation - Question 2

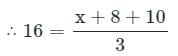
Let the average of three numbers be 16. If two of the numbers are 8 and 10, what is the remaining number?

Detailed Solution: Question 2

Concept:

Calculation:

Here n = 3. Let's say that the third number is x.

⇒ x + 18 = 48

⇒ x = 30.

MCQ: Measures of Central Tendency and Variation - Question 3

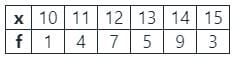
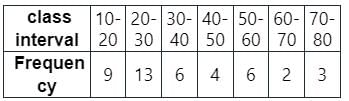
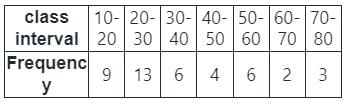
Find the mode and the median of the following frequency distribution respectively.

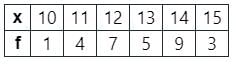
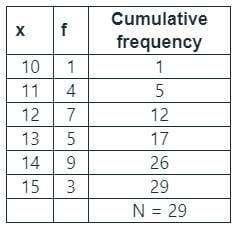
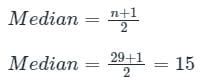
Detailed Solution: Question 3

Formula used:

If the total number of observations given is odd, then the formula to calculate the median is:

Median = {(n+1)/2}th term

If the total number of observations is even, then the median formula is:

Median  = [(n/2)th term + {(n/2)+1}th term]/2

where n is the number of observations.

Mode

The mode is the value that appears most frequently in a data set.

Given:

Calculation:

Since the frequency of x = 14 is 9 which is the maximum.

So, mode = 14

for frequency distribution,

So, the total number of observation = (1 + 4 + 7 + 5 + 9 + 3) = 29

So, 29 is ODD number, For odd number, the Median formula is, 

⇒ Median = 15th term

⇒ Frequency of the 15th term

According to the table, the value of 15th is at x = 13

so the median = 13

MCQ: Measures of Central Tendency and Variation - Question 4

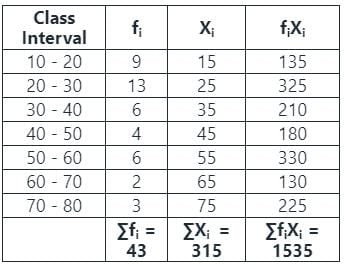
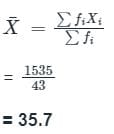
A random sample of 24 people is classified in the following table according to their ages:

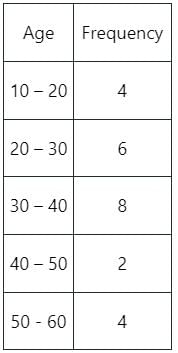
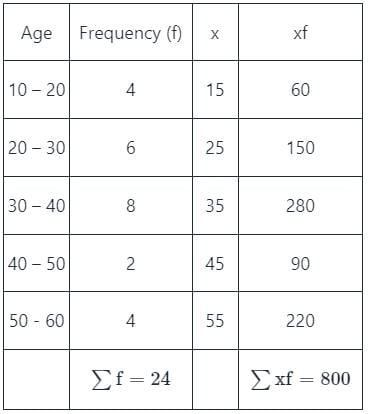
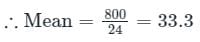
What is the mean age of this group of people?

Detailed Solution: Question 4

Concept:

Calculation:

We know that, 

MCQ: Measures of Central Tendency and Variation - Question 5

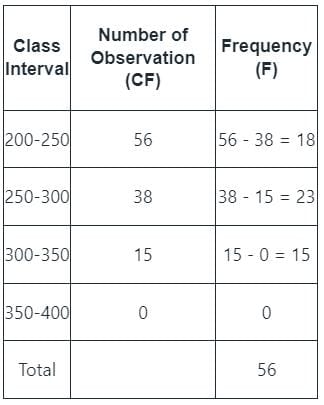
Find the no. of observations between 250 and 300 from the following data:

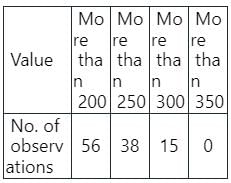
Detailed Solution: Question 5

Concept:

To find number of observations between 250 and 300.

first we have to draw a frequency distribution table from this data.

∴ The Number of observation in between 250-300 = 38 - 15 = 23.

MCQ: Measures of Central Tendency and Variation - Question 6

If the mode of the following data is 7, then the value of k in the data set 3, 8, 6, 7, 1, 6, 10, 6, 7, 2k + 5, 9, 7, and 13 is:

Detailed Solution: Question 6

Concept:

Mode is the value that occurs most often in the data set of values.

Calculation:

Given data values are 3, 8, 6, 7, 1, 6, 10, 6, 7, 2k + 5, 9, 7, and 13

In the above data set, values 6, and 7 have occurred more times i.e., 3 times

But given that mode is 7.

So, 7 should occur more times than 6.

Hence the variable 2k + 5 must be 7

⇒ 2k + 5 = 7

⇒ 2k = 2

∴ k = 1

MCQ: Measures of Central Tendency and Variation - Question 7

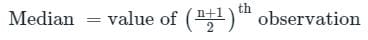
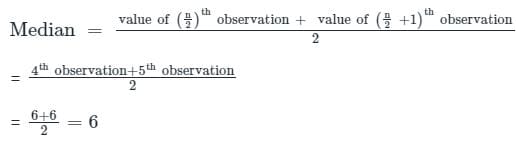
Find the median of the given set of numbers 2, 6, 6, 8, 4, 2, 7, 9

Detailed Solution: Question 7

Concept:

Median: The median is the middle number in a sorted- ascending or descending list of numbers.

Case 1: If the number of observations (n) is even

Case 2: If the number of observations (n) is odd

Calculation:

Given values 2, 6, 6, 8, 4, 2, 7, 9

Arrange the observations in ascending order:

2, 2, 4, 6, 6, 7, 8, 9

Here, n = 8 = even

As we know, If n is even then,

Hence Median = 6

MCQ: Measures of Central Tendency and Variation - Question 8

If mean and mode of some data are 4 & 10 respectively, its median will be:

Detailed Solution: Question 8

Concept:

Mean: The mean or average of a data set is found by adding all numbers in the data set and then dividing by the number of values in the set.

Mode: The mode is the value that appears most frequently in a data set.

Median: The median is a numeric value that separates the higher half of a set from the lower half. 

Relation b/w mean, mode and median:

Mode = 3(Median) - 2(Mean)

Calculation:

Given that,

mean of data = 4 and mode of  data = 10

We know that

Mode = 3(Median) - 2(Mean)

⇒ 10 = 3(median) - 2(4)

⇒ 3(median) = 18

⇒ median = 6

Hence, the median of data will be 6.

MCQ: Measures of Central Tendency and Variation - Question 9

Find the mean of given data:

Detailed Solution: Question 9

Formula used:

The mean of grouped data is given by,

Xi = mean of ith class

fi = frequency corresponding to ith class

Given:

Calculation:

Now, to calculate the mean of data will have to find ∑fiXi and ∑fi as below,

Then,

We know that, mean of grouped data is given by

Hence, the mean of the grouped data is 35.7

MCQ: Measures of Central Tendency and Variation - Question 10

What is the mean of the range, mode and median of the data given below?

5, 10, 3, 6, 4, 8, 9, 3, 15, 2, 9, 4, 19, 11, 4

Detailed Solution: Question 10

Given:

The given data is 5, 10, 3, 6, 4, 8, 9, 3, 15, 2, 9, 4, 19, 11, 4

Concept used:

The mode is the value that appears most frequently in a data set

At the time of finding Median

First, arrange the given data in the ascending order and then find the term

Formula used:

Mean = Sum of all the terms/Total number of terms

Median = {(n + 1)/2}th term when n is odd 

Median = 1/2[(n/2)th term + {(n/2) + 1}th] term when n is even

Range = Maximum value – Minimum value 

Calculation:

Arranging the given data in ascending order 

2, 3, 3, 4, 4, 4, 5, 6, 8, 9, 9, 10, 11, 15, 19

Here, Most frequent data is 4 so 

Mode = 4

Total terms in the given data, (n) = 15 (It is odd)

Median = {(n + 1)/2}th term when n is odd 

⇒ {(15 + 1)/2}th term 

⇒ (8)th term

⇒ 6 

Now, Range = Maximum value – Minimum value 

⇒ 19 – 2 = 17

Mean of Range, Mode and median = (Range + Mode + Median)/3

⇒ (17 + 4 + 6)/3 

⇒ 27/3 = 9

∴ The mean of the Range, Mode and Median is 9

MCQ: Measures of Central Tendency and Variation - Question 11

The mean of 20 numbers is zero. Of them, at the most, how many may be greater than zero?

Detailed Solution: Question 11

Given: The mean of 20 numbers is zero

Concept used: We simply write the formula and check the terms greater than 0.

Solution:

Means of 20 numbers would be 

= (n1 + n2 +...+ n20)/20 = 0

Now we take at most case -

let us assume n1, n2, ...n19 are greater then 0

then n20 = -(n1 + n2 +...+ n19)

Hence, in at most case there are 19 elements which is greater than 0.

So, there are 19 numbers which are greater than zero

MCQ: Measures of Central Tendency and Variation - Question 12

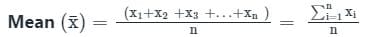
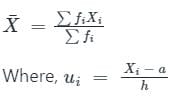
Which of the following is the correct formula for the arithmetic mean?

Detailed Solution: Question 12

The correct answer is The formula for arithmetic mean is the total sum of values of observations divided by the number of observations.

Key Points 

The correct formula for the arithmetic mean is:

Arithmetic mean = (Sum of all observations) / (Total number of observations)
This formula can be used to calculate the arithmetic mean of any set of numbers, regardless of whether the numbers are grouped or ungrouped.

Here is an example of how to use the formula:

Suppose we have the following set of numbers: 1, 2, 3, 4, 5.

To calculate the arithmetic mean, we would first sum all of the numbers:

1 + 2 + 3 + 4 + 5 = 15

Then, we would divide the sum by the total number of observations:

15 / 5 = 3

Therefore, the arithmetic mean of the set of numbers is 3.
The arithmetic mean is a useful measure of central tendency, and it is often used to summarize data and to make comparisons between different groups of data.

MCQ: Measures of Central Tendency and Variation - Question 13

The number of observations smaller than _________ is the same as the number of observations larger than it.

Detailed Solution: Question 13

Key Points

  • The median is the middle value in a set of data. When the data is arranged in order from least to greatest, the median is the value that has half of the data values less than it and half of the data values greater than it.
  • Therefore, the number of observations smaller than the median is the same as the number of observations larger than it.

MCQ: Measures of Central Tendency and Variation - Question 14

For the given set of data: 4, 4, 5, 6, 6 which of the following is true?

Detailed Solution: Question 14

Let's calculate the mean, median, and mode for the given set of data: 4, 4, 5, 6, 6.

  1. Mean: Mean = 4 + 4 + 5 + 6 + 65 = 255 = 5" id="MathJax-Element-1-Frame" role="presentation" style="position: relative;" tabindex="-1">Mean = 4 + 4 + 5 + 6 + 65 = 255 = 5" id="MathJax-Element-24-Frame" role="presentation" style="position: relative;" tabindex="0">

  2. Median:

    • Since the data set is already sorted (4, 4, 5, 6, 6), the median is the middle value, which is 5.
  3. Mode:

    • The mode is the value(s) that occur most frequently. In this case, both 4 and 6 occur twice, so the data set is bimodal, and there is no single mode.

Now, let's check the options:

  • Mean = Median: This is true since both the mean and median are 5.

  • Mean = Mode: This is not true because there is no single mode in this dataset.

  • Mode = Median: This is not true since the data is bimodal (two modes), and the median is 5.

  • Mean is less than Median: This is not true since the mean (5) is equal to the median (5).

Therefore, the correct statement is "Mean = Median."

MCQ: Measures of Central Tendency and Variation - Question 15

The mean monthly salary paid to 77 employees in a company was Rs. 78. The mean salary of 32 of them was Rs. 45 and of the other 25 was Rs. 82. What was the mean salary of the remaining? 

Detailed Solution: Question 15

Given:

Total number of employees (n) = 77

Mean salary of all employees = Rs. 78

Number of employees with salary Rs. 45 = 32

Number of employees with salary Rs. 82 = 25

Concept used:

Total sum of salaries = Mean salary × Total number of employees

Calculation:

Total salaries for employees with salary Rs. 45

⇒ 45 ×  32 = Rs. 1440

Total salaries for employees with salary Rs. 82 

⇒ 82 × 25 = Rs. 2050

Total sum of salaries = 78 × 77 = Rs. 6006

Total salaries of remaining employees

⇒ Total sum of salaries - Sum of salaries for known employees
⇒ 6006 - 1440 - 2050 = Rs. 2516

Now, Mean salary of the remaining employees

⇒ 2516/(77 - 32 - 25) = 2516/20 = 125.8

∴ The mean salary is 125.8

319 videos|366 docs|157 tests
Information about MCQ: Measures of Central Tendency and Variation Page
In this test you can find the Exam questions for MCQ: Measures of Central Tendency and Variation solved & explained in the simplest way possible. Besides giving Questions and answers for MCQ: Measures of Central Tendency and Variation, EduRev gives you an ample number of Online tests for practice
Download as PDF